Visualizing Financial Performance with a Pet Parrot Table Slide
RJ0800040_22
- Last Update 08/11/2025
- File Size 0.3MB
- # of Slides 2
- File Format PPTX
- Slide Ratio 16:9
- Color
Keywords
- #Content-Based Slides
- #Design-Based Slides
- #Financial Plans and Performance
- #Diagram
- #Balance Sheet
- #Key Financial Indicators
- #Table
- #16:9
- #financial performance table PowerPoint slide
- #financial data visualization slide
- #business metrics table design
- #how to create financial tables in PowerPoint
- #dual-color financial presentation slide
About the Product
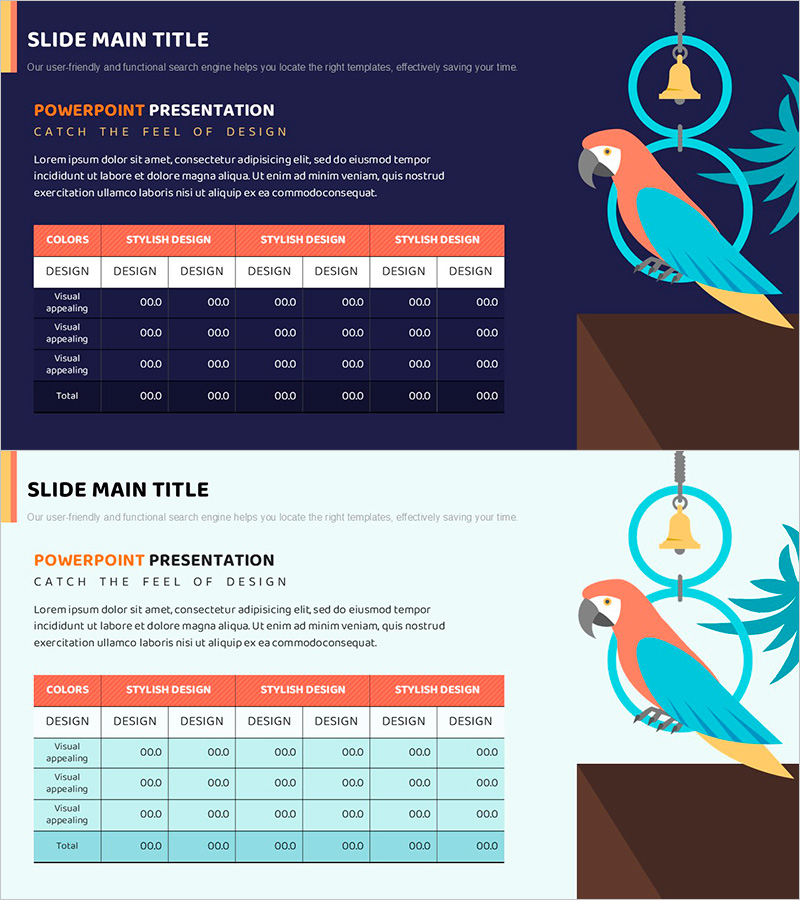
A 2-slide set designed to visualize financial data and performance metrics with clarity and impact. Available in two color options—dark blue and light blue backgrounds—each slide features a structured table layout with input areas for rows and columns. The left side provides space for text descriptions and titles, while the right side displays a colorful parrot illustration paired with geometric shapes for visual balance. Delivered in PPTX format optimized for 16:9 widescreen presentations, enabling immediate use in professional business environments. Perfect for financial reports, quarterly earnings presentations, investor briefings, and performance reviews where numerical data needs to be communicated effectively.
Usage Points
-
Main Usage
This slide template enables clear presentation of quantitative financial information—revenue figures, expenses, profit margins, KPIs, and performance indicators—in an organized table format. The row-and-column structure supports comparative analysis, trend tracking, category-based performance breakdowns, and multi-period financial comparisons.
-
How to Use
Input your financial data directly into the table cells (sales, costs, profits, ratios, etc.). Select either the dark blue or light blue background version to match your presentation's visual tone. Add analytical commentary or interpretation in the left text area. The parrot illustration and geometric elements are fixed but can be removed if preferred.
-
Recommended For
Finance professionals, CFOs, controllers, and executives presenting to investors, shareholders, board members, and internal stakeholders. Ideal for quarterly earnings reports, annual financial statements, business performance reviews, investor relations (IR) presentations, and strategic planning sessions requiring data-driven decision support.
-
Slide Structure
Each slide uses a 2-column layout: left side for titles and explanatory text, right side for the data table. The table contains 4–5 data rows and 6–7 columns with an orange-highlighted header row and white data cells. The upper right corner features a parrot illustration and geometric shapes that provide visual interest without overwhelming the data presentation.
Related Products
-

Visualizing Financial Performance with Comparison Tables – Transparent Information Delivery
#Financial Plans and Performance #Diagram #Balance Sheet
-

Balance Sheet Table Slide – Foundation for Financial Planning
#Financial Plans and Performance #Diagram #Balance Sheet
-

Balance Sheet Chart for Financial Planning Slide
#Financial Plans and Performance #Diagram #Balance Sheet
-

Construction Business Balance Sheet - The Start of Clear Financial Management
#Financial Plans and Performance #Diagram #Balance Sheet
