Estimated Income Report Table Chart – Visualizing Financial Plans and Performance
RM0500008_25
- Last Update 02/22/2025
- File Size 0.3MB
- # of Slides 2
- File Format PPTX
- Slide Ratio 16:9
- Color
Keywords
About the Product
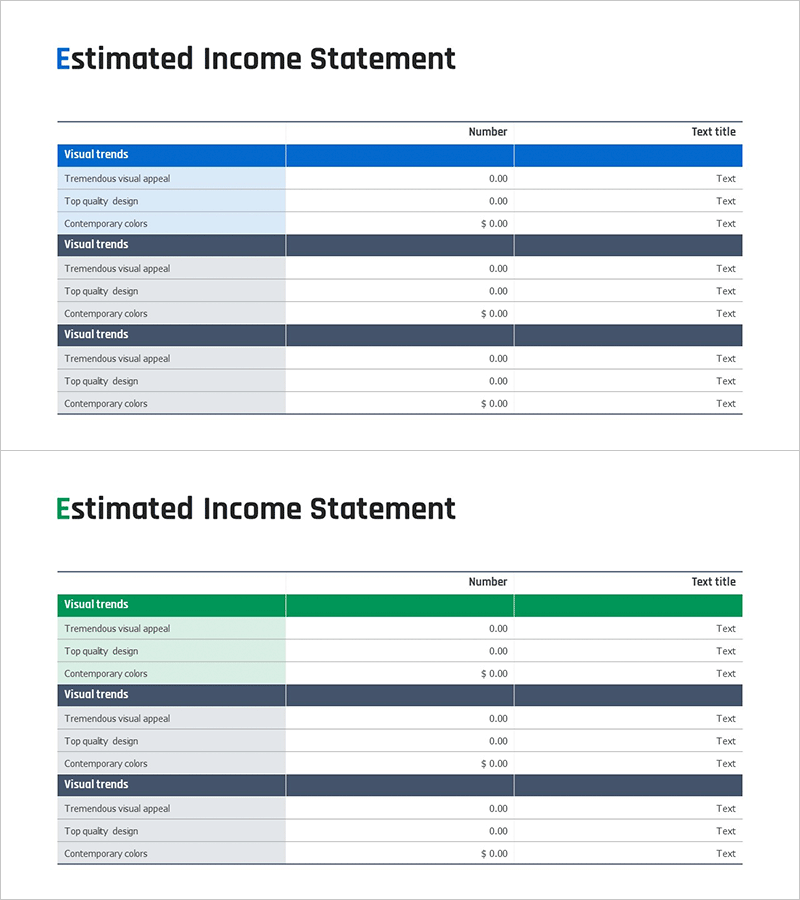
A PowerPoint table slide that clearly visualizes financial plans and performance through an estimated income report format. This 2-slide presentation features three color header options—blue, green, and navy—applied to a structured table layout. Each slide includes a 'Visual trends' section with editable rows for revenue items (Tremendous visual appeal, Top quality design, Contemporary colors), a numeric column, and a text description column. Ideal for income statements, budget forecasts, and revenue analysis in financial reports, this slide enhances data readability and supports executive decision-making in investor presentations and financial briefings.
Usage Points
-
Main Usage
This slide organizes and visualizes key financial metrics—revenue, expenses, and profit—in table format for financial reports. It strengthens data readability and credibility in investor presentations, executive briefings, and financial analysis meetings.
-
How to Use
Enter revenue item names and corresponding figures in each table row. Select a color header (blue, green, or navy) that matches your corporate brand, and customize row counts or item labels as needed to create a tailored financial table.
-
Recommended For
CFOs, finance managers, executives, and investor relations professionals presenting quarterly or annual financial performance. Suitable for business plans, investment pitch decks, management reports, and financial analysis presentations.
-
Slide Structure
2-slide layout with a 'Visual trends' header followed by 3 editable data rows per slide. Each row contains three columns: item name (text), numeric value, and description (text). Color headers clearly distinguish sections and improve visual organization.
Related Products
-

Sales and Profit Table – Financial Performance Visualization
#Financial Plans and Performance #Diagram #Income Statement
-

Income Statement Table – Clear Visualization of Financial Performance
#Financial Plans and Performance #Diagram #Income Statement
-

Sales and Profit Comparison Graph & Table – Clear Financial Analysis
#Financial Plans and Performance #Diagram #Graph
-

Internet Shopping Sales and Profit Calculation Chart – Your Business Success Guide
#Financial Plans and Performance #Diagram #Graph
