Revenue Growth Analysis Graph & Table - Financial Condition and Data Visualization
RM0500007_7
- Last Update 02/22/2025
- File Size 2.3MB
- # of Slides 2
- File Format PPTX
- Slide Ratio 16:9
- Color
Keywords
- #Content-Based Slides
- #Design-Based Slides
- #Business Introduction
- #Diagram
- #Graph
- #Other
- #Business Understanding
- #Table
- #Standard Table
- #16:9
- #financial condition analysis PowerPoint
- #table and chart slide template
- #time series data visualization
- #financial presentation slide
- #revenue growth graph template download
About the Product
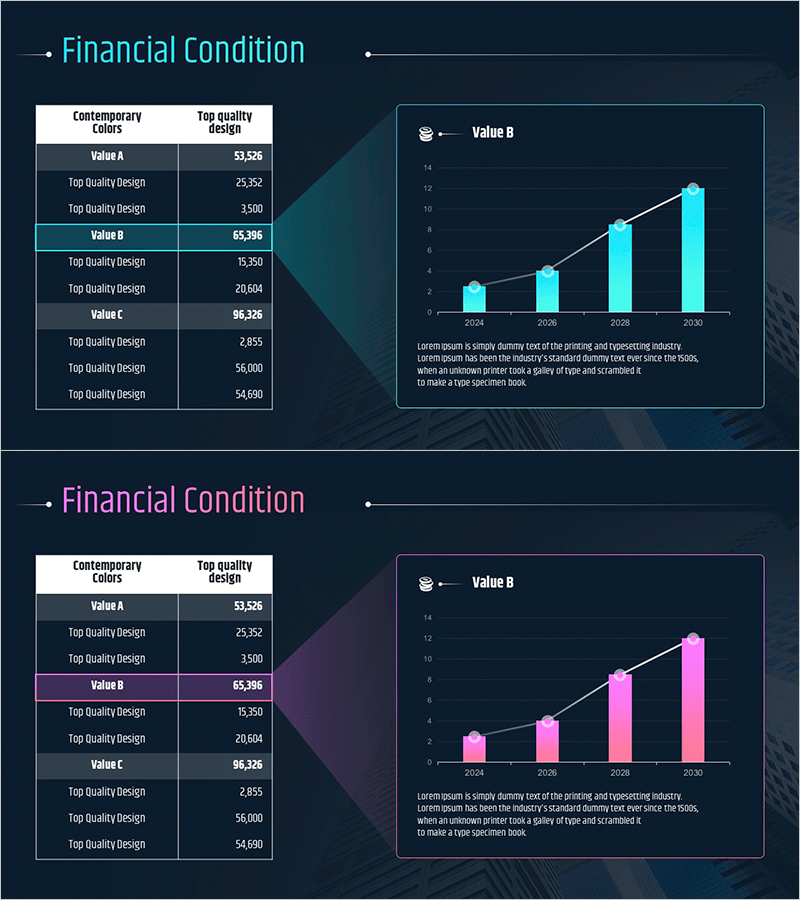
A 2-slide PowerPoint presentation for financial condition analysis. The left side features a structured table displaying Value A, B, and C metrics categorized by Contemporary Colors and Top quality design, while the right side presents a line chart visualizing 2024–2030 trends with connected data points. Two color variants—cyan and magenta—are included to match your presentation context. The table rows clearly separate data categories, and the line graph emphasizes growth trajectory and year-over-year changes. Ideal for investor presentations, financial reports, quarterly earnings reviews, and business performance analyses. Fully editable and ready for immediate use in corporate presentations.
Usage Points
-
Main Usage
Present financial metrics and revenue growth trends simultaneously through a structured table and line chart, enabling clear data storytelling to investors and executives. The left table emphasizes precise numerical comparison, while the right graph highlights temporal trends, demonstrating both financial stability and growth potential.
-
How to Use
Deploy in investor relations (IR) presentations, quarterly/annual business performance reports, and executive financial briefings. Replace table values with actual financial data and adjust graph data points to reflect your organization's metrics. Select either the cyan or magenta color variant to align with corporate branding guidelines.
-
Recommended For
CFOs, financial analysts, investor relations teams, C-suite executives, business planning departments, and management consulting firms. Suitable for shareholder meetings, bank loan applications, board-level presentations, and stakeholder financial updates requiring data-driven decision-making.
-
Slide Structure
Slide 1: Cyan color scheme – Left side 3-row table (Value A, B, C with 2–3 sub-items each), right side 4-point line chart (2024–2030 years). Slide 2: Magenta color scheme – identical structure with alternate color palette. Table headers labeled Contemporary Colors and Top quality design; chart Y-axis 0–14, X-axis year markers.
Related Products
-

Point Distribution Positioning Map – Visualization of Marketing Strategy
#Marketing Plan and Strategy #Diagram #Graph
-

Construction Company Debt and Capital Structure Analysis Chart
#Business Introduction #Market and Competitor Analysis #Diagram
-

Industrial Data Report for Market Analysis Slides
#Market and Competitor Analysis #Diagram #Graph
-

Financial Performance and Forecast – Diagram for Business Strategy
#Business Strategy #Financial Plans and Performance #Diagram
