Industrial Data Report for Market Analysis Slides
RM0800008_5
- Last Update 02/28/2025
- File Size 0.3MB
- # of Slides 2
- File Format PPTX
- Slide Ratio 16:9
- Color
Keywords
- #Content-Based Slides
- #Design-Based Slides
- #Market and Competitor Analysis
- #Diagram
- #Graph
- #Other
- #Market Status
- #Market Analysis
- #Table
- #Standard Table
- #16:9
- #market analysis table PowerPoint
- #data comparison slides
- #stacked bar chart table
- #industrial data report slide
- #numerical comparison diagram PowerPoint
About the Product
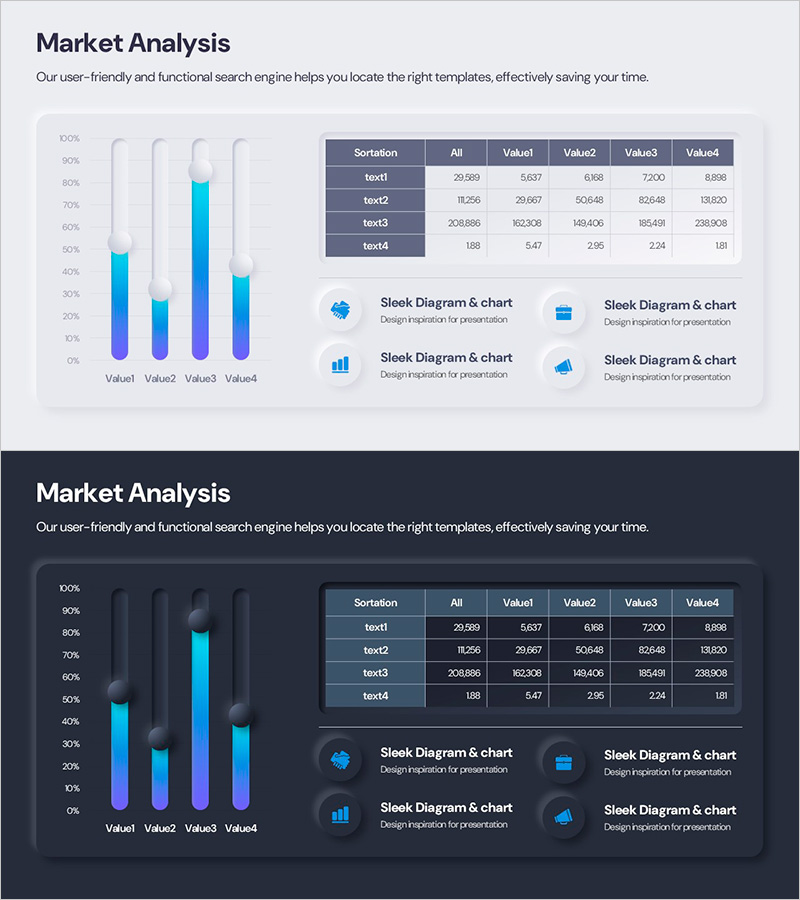
A PowerPoint slide optimized for market analysis and industrial data reports. This presentation combines a stacked bar chart with a data table to simultaneously express numerical comparisons and trend analysis. The bar graph, rendered in blue and cyan gradient across four items (Value1 through Value4), clearly visualizes proportional relationships, while the right-side table displays detailed metrics (All, Value1, Value2, Value3, Value4) sorted by Sortation category. The 2-slide set includes both light and dark background versions, allowing you to match your presentation environment and document style. Fully editable in PPTX format—simply input your data and it automatically updates across the chart and table.
Usage Points
-
Main Usage
Designed for market analysis reports and industrial data presentations where you need to communicate both numerical comparisons and trends simultaneously. The stacked bar graph provides instant visual understanding of overall composition ratios, while the accompanying table delivers precise figures to enhance audience comprehension.
-
How to Use
Use in executive briefings, market research presentations, and competitive analysis sessions. Replace the graph colors and table values with your own data for immediate deployment. Choose between light or dark background versions to match your presentation environment and maintain visual consistency throughout your deck.
-
Recommended For
Ideal for marketing managers, business analysts, business development teams, management consultants, and financial analysts who rely on data-driven decision-making. Particularly suited for quarterly market status reports, new business feasibility reviews, and competitive landscape analysis presentations.
-
Slide Structure
Two-slide set, each featuring a stacked bar graph on the left (4 items with blue-to-cyan gradient) and a data table on the right (4 rows by 6 columns: Sortation, All, Value1, Value2, Value3, Value4). Light and dark background versions provided separately for flexible deployment across different presentation contexts.
Related Products
-

Sales and Cost Area Graphs – Market Analysis Visualization
#Market and Competitor Analysis #Graph #Other
-

Graph Slide Highlighting the Importance of Drinking Water - Market Analysis
#Market and Competitor Analysis #Graph #Other
-

Gradient Theme Area Diagram – Market and Competitor Analysis
#Market and Competitor Analysis #Diagram #Graph
-

Triangular Pattern Presentation Template Area Chart – Market Analysis and Competitive Edge
#Market and Competitor Analysis #Graph #Other
