Point Distribution Positioning Map – Visualization of Marketing Strategy
RM0400004_9
- Last Update 02/15/2025
- File Size 2MB
- # of Slides 2
- File Format PPTX
- Slide Ratio 16:9
- Color
Keywords
- #Content-Based Slides
- #Design-Based Slides
- #Marketing Plan and Strategy
- #Diagram
- #Graph
- #Other
- #Positioning
- #Marketing Strategy
- #Table
- #Standard Table
- #16:9
- #positioning map PowerPoint
- #4-quadrant diagram slide
- #marketing strategy chart
- #competitive analysis template
- #positioning map template download
About the Product
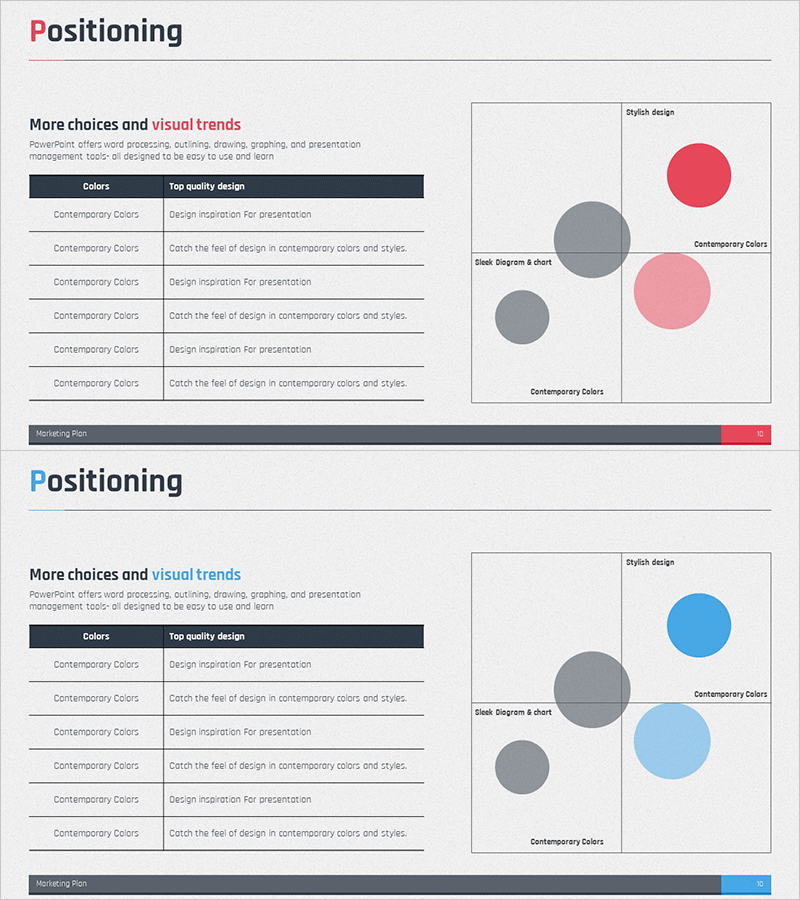
A 4-quadrant positioning map PowerPoint slide template designed to visualize competitive positioning and market strategy at a glance. This presentation slide features two color schemes (red-pink tone and blue tone), with each slide displaying X and Y axis labels and circular nodes distributed across four quadrants. Ideal for product positioning, market analysis, and competitive strategy presentations, this PowerPoint template allows you to input data and immediately use it in your pitch deck or business presentation.
Usage Points
-
Main Usage
Visualize product or service market positioning using two variables on the X and Y axes to show relative competitive positioning. Used in marketing strategy development, new product launch planning, and market entry strategy presentations, this diagram places competitors and your product in four quadrants to clearly communicate differentiation strategy.
-
How to Use
Customize the X and Y axis labels to match your analysis criteria (price vs. quality, features vs. design, etc.), then add product names or competitor names to the circular nodes in each quadrant. Adjust node size and color to represent market share or brand strength, and insert the slide into marketing plans, business proposals, or investment pitch decks to explain strategic positioning.
-
Recommended For
Marketing managers, product planners, business executives preparing reports, startup founders pitching to investors, consulting firms conducting strategy analysis, new business development teams, and market research professionals who need to communicate competitive landscape and positioning strategy visually.
-
Slide Structure
2-slide set. Each slide is divided into 4 quadrants around a central intersection point, with X and Y axis labels indicating analysis criteria. Each quadrant contains 3-4 circular nodes for positioning data, available in two color versions: red-pink tone and blue tone. Optimized for 16:9 widescreen format.
Related Products
-

Competitive Comparison Analysis Positioning Map
#Marketing Plan and Strategy #Graph #Other
-

Positioning Analysis for Market Entry – Target Customer Segmentation Strategy
#Marketing Plan and Strategy #Graph #Other
-

Competitive Market Positioning Analysis Chart - Essential for Marketing Strategy
#Marketing Plan and Strategy #Diagram #Graph
-

Brand Strategy Using Positioning Map
#Marketing Plan and Strategy #Graph #Other
