Male and Female Analysis Graphs and Tables – Gender Statistics Visualization
RJ0600067_13
- Last Update 07/07/2025
- File Size 0.2MB
- # of Slides 2
- File Format PPTX
- Slide Ratio 16:9
- Color
Keywords
- #Content-Based Slides
- #Design-Based Slides
- #Market and Competitor Analysis
- #Diagram
- #Graph
- #Other
- #Customer Analysis
- #Table
- #Standard Table
- #16:9
- #gender ratio analysis PowerPoint
- #male female statistics slide
- #infographic presentation template
- #demographic data visualization
- #population analysis slide
About the Product
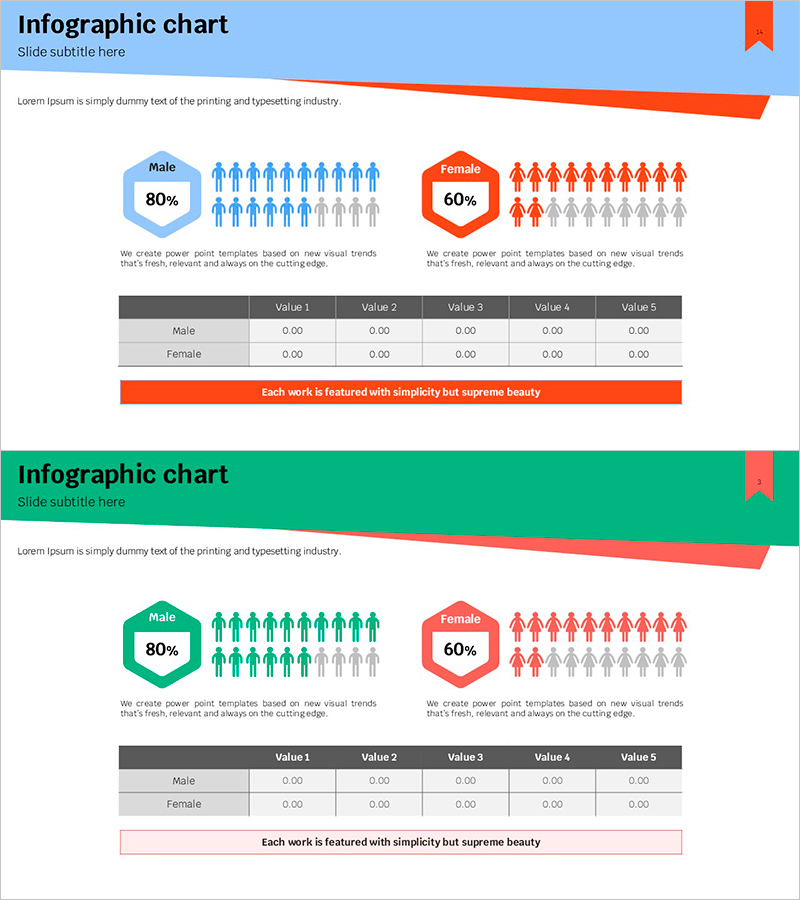
A professional infographic PowerPoint slide that visually compares male and female ratios using hexagonal badges, human icons, and data tables. The design features a dual-color scheme—blue and orange on the first slide, green and red on the second—to clearly distinguish gender categories. Each slide includes percentage displays in hexagonal badges, icon-based population representation with 10 figures per gender, a structured data table with five value columns, and a highlighted summary banner. The two-slide set provides flexible color options for different presentation contexts. Ideal for demographic analysis, customer segmentation, workforce composition, and statistical reports in business, academic, and research presentations.
Usage Points
-
Main Usage
Designed to present gender composition data, demographic statistics, customer segmentation, and workforce analysis at a glance. The hexagonal badges display percentages, human icons represent population counts, and the data table provides numerical values—all aligned for credible statistical communication.
-
How to Use
Use in marketing reports for target audience analysis, HR presentations for workforce composition, demographic research presentations, academic studies on sample populations, and market segmentation analyses. The blue-orange combination suits corporate presentations, while the green-red version works well for educational and research materials.
-
Recommended For
Marketing teams presenting customer demographics, HR departments reporting organizational composition, research institutions and statistical agencies, educational institutions analyzing student populations, consulting firms conducting market segmentation, and government agencies presenting census data.
-
Slide Structure
Each slide contains a title area, left section with male data (hexagonal badge showing 80% + 10 human icons), right section with female data (hexagonal badge showing 60% + 10 human icons), central data table (male and female rows × 5 value columns), and a bottom highlight banner. Both slides maintain identical structure with color variations.
Related Products
-

Participation Rate and Exercise Schedule – Efficient Operations Plan
#Operational Plan #Market and Competitor Analysis #Diagram
-

Graphic Designer Demand Analysis Slide – Market Insights and Customer Statistics
#Market and Competitor Analysis #Graph #Other
-

Camping Competitor Characteristic Analysis Pentagon Graph
#Market and Competitor Analysis #Diagram #Graph
-

Gender-Based Automotive Demand Analysis Slide
#Market and Competitor Analysis #Graph #Other
