IT Security Business Performance Management Slide
RM0500007_15
- Last Update 02/21/2025
- File Size 4.4MB
- # of Slides 2
- File Format PPTX
- Slide Ratio 16:9
- Color
Keywords
- #Content-Based Slides
- #Design-Based Slides
- #Company Introduction
- #Business Strategy
- #Diagram
- #Key Achievements
- #Achievements
- #Cluster
- #Closed Cluster Diagram
- #16:9
- #radial diagram PowerPoint slide
- #business performance presentation template
- #IT security slide deck
- #how to create radial diagram in PowerPoint
- #management achievement slide download
About the Product
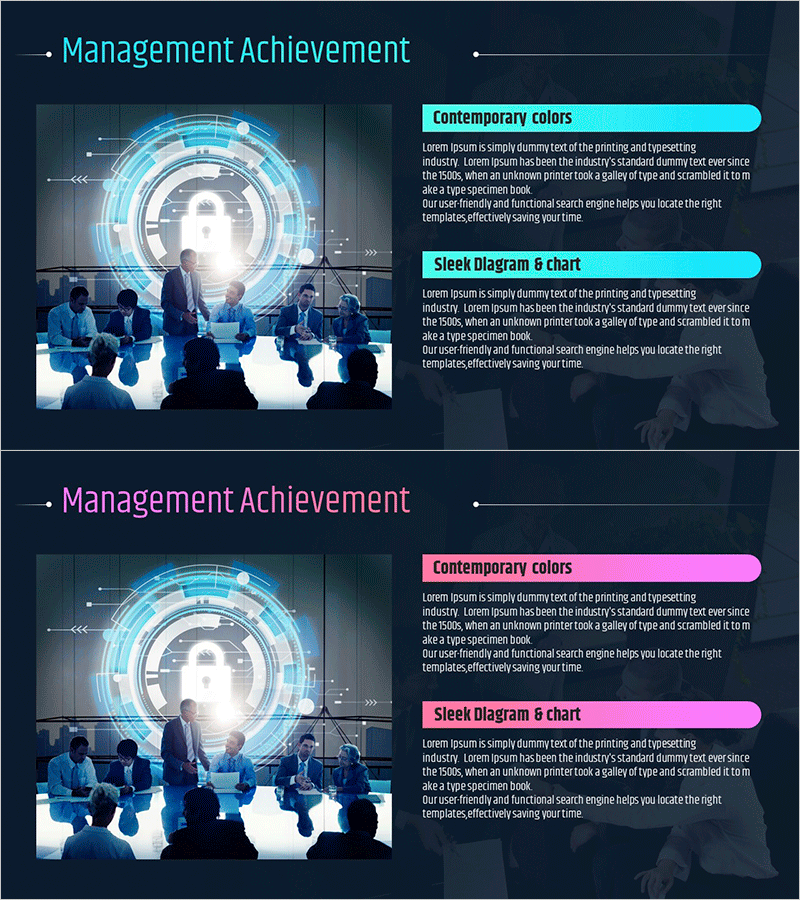
A radial diagram PowerPoint slide designed to visualize IT security business performance metrics. The central hub connects to four directional nodes, enabling clear presentation of business strategy execution, performance achievement, risk management, and operational results. Dark navy background with cyan accent lines and semi-transparent circular layers emphasizes technical expertise and data-driven decision-making. Supplied as a 16:9 widescreen 2-slide set, ready for executive presentations, quarterly business reviews, and strategic planning meetings. All text and shapes are fully editable for customized KPI input and organizational branding.
Usage Points
-
Main Usage
Present IT security department's annual performance metrics to executives using a central-hub radial structure that emphasizes core achievement areas: business execution, strategic implementation, performance targets, and risk mitigation. The radial layout conveys equal importance across all four dimensions while maintaining visual hierarchy through the central focal point.
-
How to Use
Insert into executive summary sections of annual reports or quarterly business review presentations. Replace center text with department name and reporting period, then populate the four outer nodes with specific KPIs (revenue growth, customer satisfaction, technology innovation, risk reduction percentage). Use as a dashboard-style visual that enables stakeholders to grasp performance status at a glance.
-
Recommended For
IT security directors, CTOs, C-suite executives / Annual and quarterly business performance reports / Strategic planning and executive briefing sessions / Business metrics and KPI presentations / Data-driven decision-making materials / Technology department performance dashboards
-
Slide Structure
2-slide set: Slide 1 features a radial diagram with 5 nodes (1 central hub + 4 directional nodes), each with editable text fields. Slide 2 provides the same structure with alternate color scheme (cyan to magenta accent). Dark navy background with semi-transparent geometric patterns; all elements are vector-based and fully customizable.
Related Products
-

Medal Text Box – Highlighting Achievements in Presentations
#Company Introduction #Business Strategy #Diagram
-

Key Performance Diagram - Clarity for Business Strategy
#Company Introduction #Business Strategy #Diagram
-

Conservation Donut Chart – Visualization of Sustainability
#Company Introduction #Market and Competitor Analysis #Diagram
-

Sewing Graph Chart – Market Status and Performance Analysis
#Business Strategy #Market and Competitor Analysis #Diagram
