Key Performance Diagram - Clarity for Business Strategy
RM0800002_11
- Last Update 02/27/2025
- File Size 9MB
- # of Slides 2
- File Format PPTX
- Slide Ratio 16:9
- Color
Keywords
- #Content-Based Slides
- #Design-Based Slides
- #Company Introduction
- #Business Strategy
- #Diagram
- #Key Achievements
- #Achievements
- #Cluster
- #Closed Cluster Diagram
- #16:9
- #closed diagram PowerPoint
- #performance metrics slide template
- #3-item comparison diagram
- #business performance presentation
- #KPI diagram PowerPoint template
About the Product
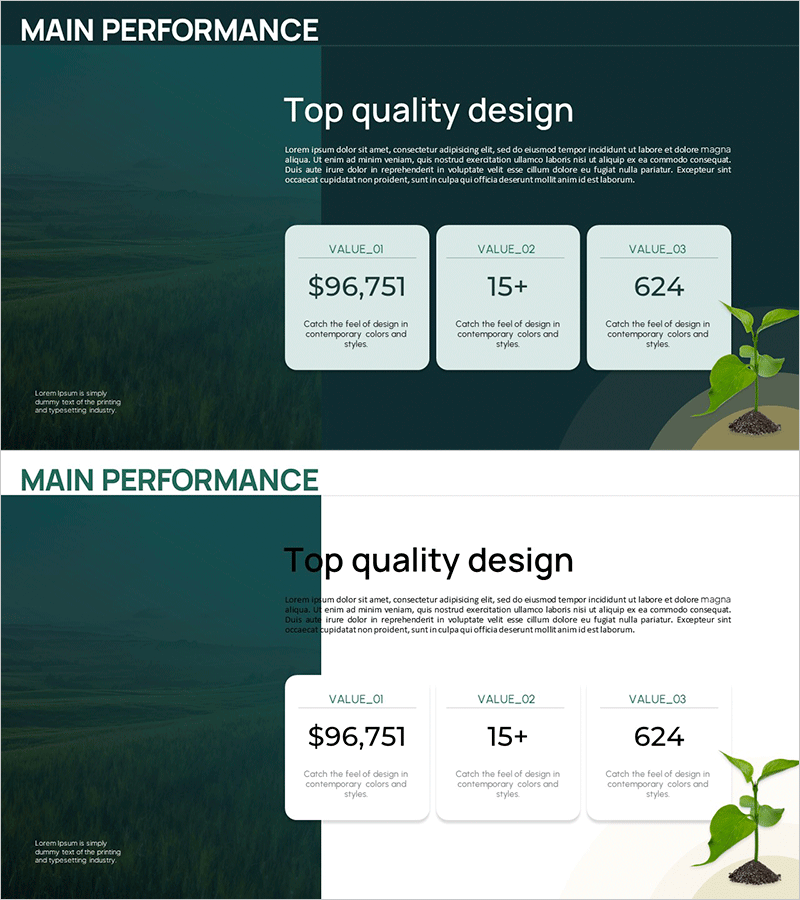
A 3-item closed-form diagram PowerPoint slide designed to visualize business performance and key metrics. Set against a dark green background with three white text boxes, this presentation template clearly displays key performance indicators, metrics, and business strategy. The 16:9 widescreen format with 2-slide composition is ready to use in executive reports, business plan presentations, and strategic meetings. Each item accommodates numerical data and descriptions, making it ideal for comparing various performance metrics and KPI dashboards in professional presentations.
Usage Points
-
Main Usage
Clearly communicates key performance indicators (KPIs) and business strategy by dividing them into three distinct items. Ideal for executive reports, business performance presentations, and strategic meetings where highlighting core metrics is essential.
-
How to Use
Input performance figures, metric names, and descriptions into each text box. The dark green background conveys trust and stability, making it suitable for corporate reports, investor presentations, and management strategy briefings. The 2-slide composition supports comparative analysis and sequential explanations.
-
Recommended For
CFOs, executives, business managers, and strategic planning teams presenting quarterly performance reports, annual business plans, and investor relations materials. Highly effective in finance, consulting, manufacturing, and distribution industries where data-driven decision-making is critical.
-
Slide Structure
Dark green background with three white rounded text boxes arranged horizontally. Each box includes VALUE_01, VALUE_02, VALUE_03 labels with dedicated areas for numerical input, titles, and descriptive text. A plant illustration in the bottom right corner adds a natural, professional business tone.
Related Products
-

IT Security Business Performance Management Slide
#Company Introduction #Business Strategy #Diagram
-

Medal Text Box – Highlighting Achievements in Presentations
#Company Introduction #Business Strategy #Diagram
-

Awards and Certificates Slide
#Company Introduction #Diagram #Awards and Certifications, and Patents
-

Slide Introducing Awards by Category
#Company Introduction #Diagram #Awards and Certifications, and Patents
