Graph of Financial Outlook Analysis after Investment Attraction
RM0500006_7
- Last Update 02/21/2025
- File Size 0.6MB
- # of Slides 2
- File Format PPTX
- Slide Ratio 16:9
- Color
Keywords
- #Content-Based Slides
- #Design-Based Slides
- #Business Introduction
- #Market and Competitor Analysis
- #Diagram
- #Graph
- #Market Analysis
- #Table
- #Column
- #Standard Table
- #Grouped Column
- #16:9
- #grouped bar chart PowerPoint
- #financial analysis slide template
- #year-over-year comparison graph
- #investment pitch presentation
- #financial outlook chart download
About the Product
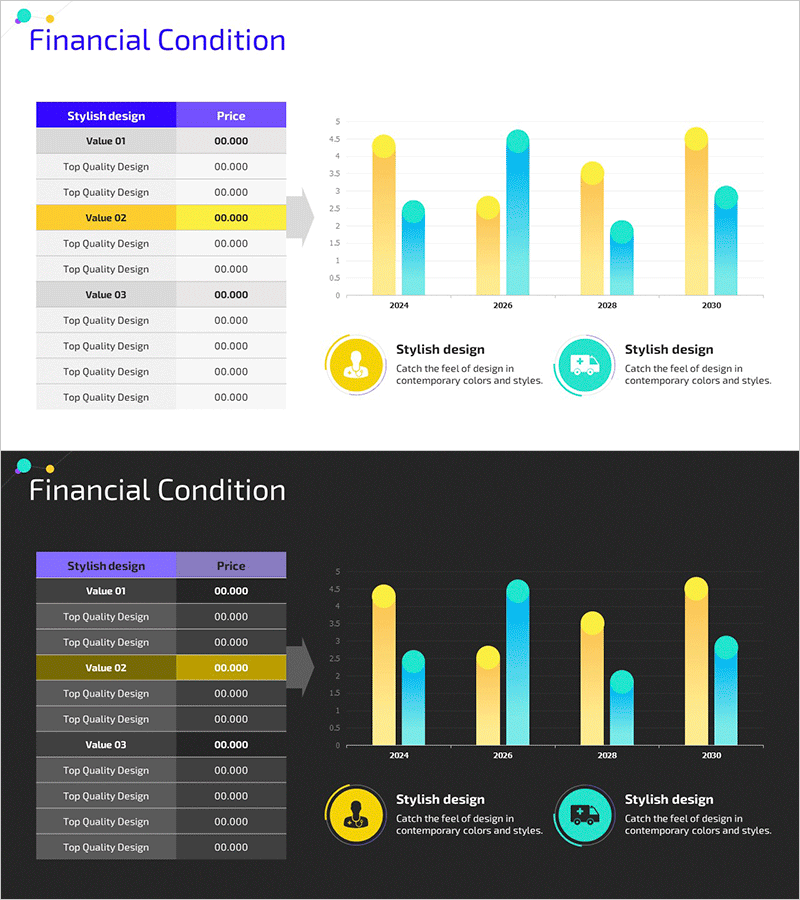
A grouped bar chart PowerPoint slide for analyzing financial outlook after investment attraction. This presentation template visualizes financial data across four years from 2024 to 2030 using two data series in yellow and teal colors, enabling clear year-over-year comparison. The left side features a structured table with Value 01, 02, and 03 categories and descriptions, while the right side displays the corresponding bar chart showing numerical trends. Ideal for investment pitches, business plans, and financial presentations where you need to communicate fiscal health and growth projections persuasively to stakeholders.
Usage Points
-
Main Usage
Communicate financial performance and future projections year-by-year to investors and stakeholders, demonstrating fiscal stability and growth potential. The dual-color bar grouping emphasizes comparative analysis and makes data interpretation intuitive for audiences.
-
How to Use
Enter financial categories and descriptions in the left table (Value 01, 02, 03), then update the chart data with actual figures. Adjust bar heights to reflect your financial trends and modify series colors to match corporate branding. During presentation, highlight year-over-year changes and growth rates while discussing revenue or profitability shifts.
-
Recommended For
CFOs, financial officers, and investor relations professionals presenting at investor meetings, business plan pitches, and financial reports. Suitable for startup fundraising decks, quarterly earnings presentations, and credit evaluation materials for financial institutions.
-
Slide Structure
2-slide set. Slide 1: Light background with left table (Value 01/02/03 plus 3 description rows) and right grouped bar chart (2024–2030, 2 series, yellow and teal). Slide 2: Dark background with identical layout for evening presentation environments. All table and chart elements are fully editable vector objects.
Related Products
-

Financial Status Analysis Chart – Business Introduction and Future Insights
#Business Introduction #Market and Competitor Analysis #Diagram
-

Table Chart & Clustered Column Graph – Market and Competitor Analysis
#Market and Competitor Analysis #Diagram #Graph
-

Green Yellow Data Analysis Chart – Market and Competitive Analysis
#Business Introduction #Market and Competitor Analysis #Diagram
-

Sales and Profit Table – Visualizing Financial Performance
#Market and Competitor Analysis #Financial Plans and Performance #Diagram
