Medical Business Income Report Table – Visualizing Financial Performance
RM0500006_25
- Last Update 02/21/2025
- File Size 0.6MB
- # of Slides 2
- File Format PPTX
- Slide Ratio 16:9
- Color
Keywords
About the Product
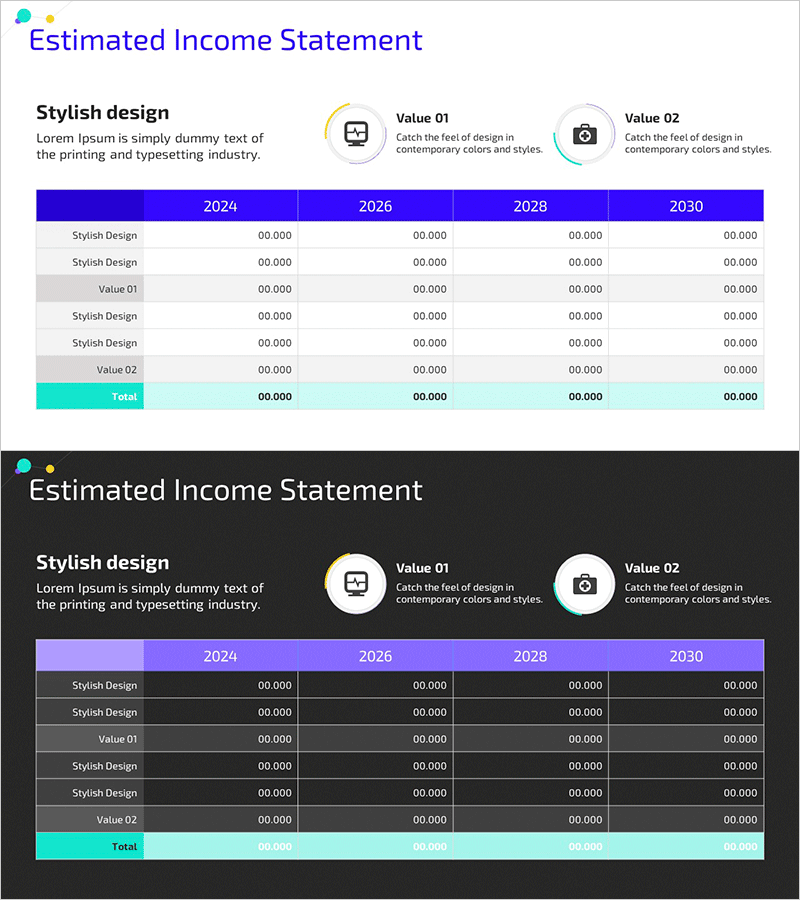
A professional income statement PowerPoint slide optimized for medical business and financial reporting. This presentation template displays financial performance across four years (2024, 2026, 2028, 2030) in a clear, comparative table layout. The design features a deep blue header with light gray and turquoise accent rows to distinguish data hierarchy. The slide includes six editable rows for line items (Stylish Design, Value 01, Value 02, Total) and four year columns for numerical data entry. Ideal for investor presentations, IR materials, executive reports, and medical institution financial disclosures.
Usage Points
-
Main Usage
Visualize medical business and corporate income statement data with a structured financial slide. Designed to compare annual revenue, expenses, and profit across multiple years, enabling clear communication of financial performance to investors, executives, and stakeholders.
-
How to Use
Enter financial line item names in each row (Stylish Design, Value 01, Value 02, Total) and input numerical data in the 2024, 2026, 2028, and 2030 columns. Keep the blue header fixed and edit only the data fields to create a professional financial report slide.
-
Recommended For
Ideal for medical institutions, hospitals, medical device companies, financial reports, medical business IR presentations, executive board meetings, investor briefings, and medical consulting proposals. Finance teams, executives, and CFOs can use this slide to support data-driven decision-making presentations.
-
Slide Structure
Two-slide layout: the first slide contains a title section with description text and two value icons (Value 01, Value 02); the second slide features a 6-row by 4-column table (2024, 2026, 2028, 2030) for financial data entry. Color coding with deep blue header, white, light gray, and turquoise rows clearly separates information hierarchy.
Related Products
-

Transportation Business Sales and Profit Table – Financial Analysis
#Financial Plans and Performance #Diagram #Income Statement
-

Profit and Loss Statement Slide – Calculating Investment Business Sales and Profits
#Financial Plans and Performance #Diagram #Income Statement
-

Sales and Bills Slide for Navigation App
#Financial Plans and Performance #Diagram #Income Statement
-

Sales and Profit Table – Clear Visualization of Financial Planning
#Financial Plans and Performance #Diagram #Other
