Cash Flow and Earnings Outlook Chart
RM0500003_7
- Last Update 02/20/2025
- File Size 1.1MB
- # of Slides 2
- File Format PPTX
- Slide Ratio 16:9
- Color
Keywords
- #Content-Based Slides
- #Design-Based Slides
- #Business Introduction
- #Market and Competitor Analysis
- #Graph
- #Future Outlook
- #Column
- #Grouped Column
- #16:9
- #grouped bar chart PowerPoint
- #cash flow chart template
- #revenue outlook graph slide
- #comparative bar graph PowerPoint slide
- #financial data visualization presentation
About the Product
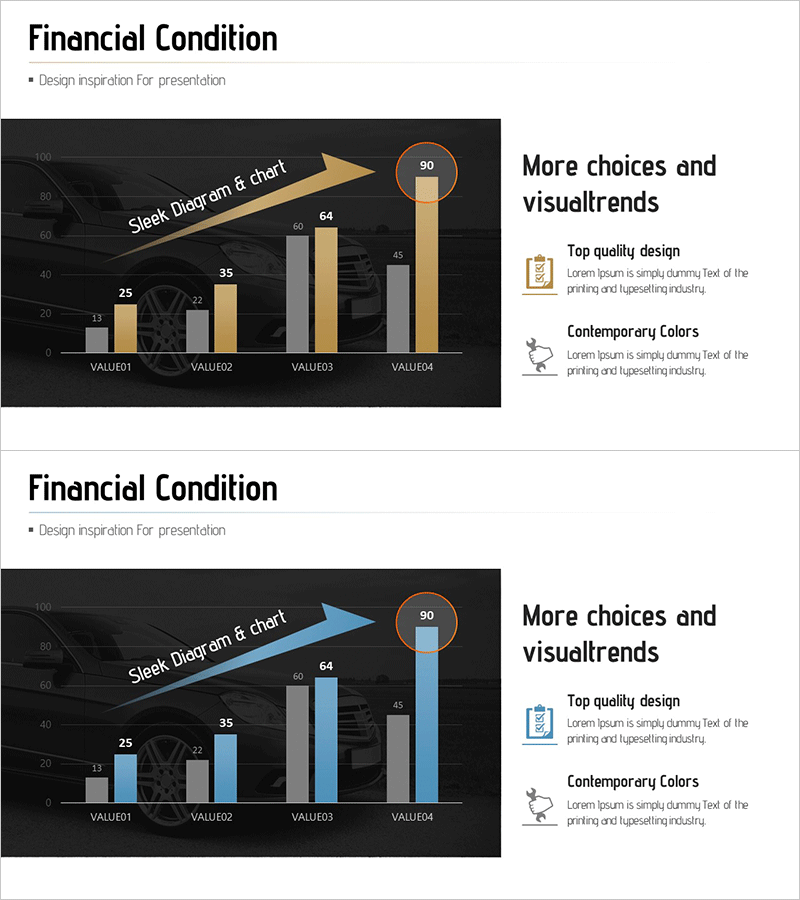
A 2-slide grouped bar chart PowerPoint presentation template for visualizing cash flow and revenue outlook across four data points (VALUE01 to VALUE04). Designed with dark background and gold and blue color schemes, the slides feature comparative bar graphs with arrow diagrams to emphasize data trends. In 16:9 widescreen PPTX format, these slides are ready to use in financial reports, business plans, and investor pitch decks. The editable structure allows automatic graph updates when you input new values.
Usage Points
-
Main Usage
Designed to present financial performance and revenue projections through objective numerical comparison. Ideal for cash flow analysis, quarterly or annual revenue comparison, and actual versus projected performance visualization. Communicates financial health credibly to investors, executives, and stakeholders.
-
How to Use
Enter numerical values in the VALUE01 through VALUE04 fields and the bar heights adjust automatically. Use the arrow diagram to emphasize trend direction, and customize colors by category or to indicate positive/negative signals. The 2-slide structure allows the first slide for overview and the second for detailed analysis.
-
Recommended For
Recommended for CFOs, finance managers, and executives preparing quarterly earnings presentations, annual business reports, and investor relations materials. Also effective for consulting firms, financial institutions, and startups creating funding pitch decks or bank credit assessment reports.
-
Slide Structure
Two slides with dark background (black and dark gray) each displaying a 4-item grouped bar chart. Slide 1 features gold bars with an arrow diagram; Slide 2 uses blue bars with a circular highlight element for color contrast. Numerical labels appear above each bar, with a 'More choices and visual trends' text area on the right side of each slide.
Related Products
-

Financial Status Analysis Chart – Business Introduction and Future Insights
#Business Introduction #Market and Competitor Analysis #Diagram
-

Bundled Charts for Infinite Energy Analysis
#Market and Competitor Analysis #Graph #Market Status
-

Car Wide Template Line Chart – Market and Competitive Analysis
#Business Introduction #Market and Competitor Analysis #Graph
-

Social Network Business Analysis – Vertical Bar Chart
#Business Introduction #Business Strategy #Graph
