Progress Pie Chart by Body Organ
RJ0400045_25
- Last Update 05/29/2025
- File Size 3MB
- # of Slides 2
- File Format PPTX
- Slide Ratio 16:9
- Color
Keywords
About the Product
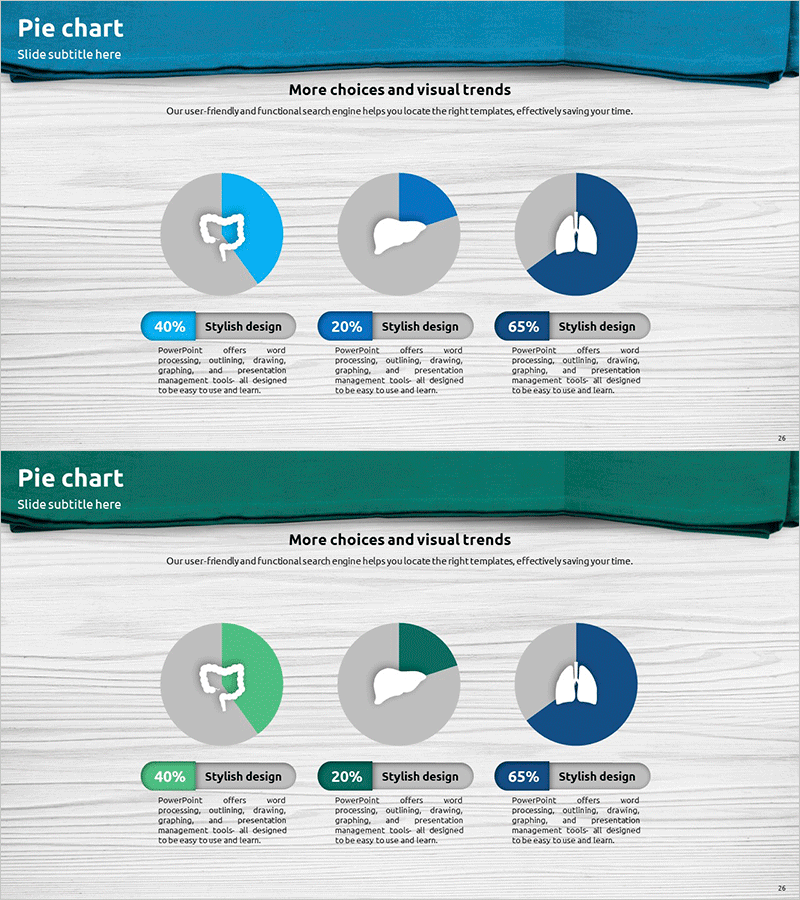
A PowerPoint slide template that visualizes progress status and proportions using a 3-segment donut pie chart. Three color-coded sections (blue 40%, green 20%, dark blue 65%) represent different data categories against a light gray background. Each segment includes an icon and text area for item descriptions. Ideal for healthcare presentations, project status reports, and performance dashboards. Includes 2 slides in 16:9 widescreen format, fully editable PPTX file. Ready to customize with your own data and labels.
Usage Points
-
Main Usage
Display proportional data across three categories such as project completion rates, healthcare resource allocation, departmental performance metrics, or budget distribution. The donut chart format allows space in the center for key statistics or summary information.
-
How to Use
Enter item names, percentages, and descriptions in the text areas below each pie segment. Modify colors to match your brand guidelines or presentation theme. Replace icons with alternatives from PowerPoint's built-in library. Insert into status reports, proposals, or strategic presentations.
-
Recommended For
Healthcare administrators presenting clinic performance metrics, project managers tracking milestone completion, marketing teams comparing channel performance, finance departments explaining budget allocation, operations teams reporting resource utilization.
-
Slide Structure
2-slide set with identical layout. Each slide features one 3-segment donut pie chart, three customizable icons, and three text boxes (for category name, percentage, and description). 16:9 aspect ratio, PPTX format with editable elements.
Related Products
-

Construction Development Status Chart – Key to Construction Market Analysis
#Product/Service Introduction #Market and Competitor Analysis #Graph
-

3D Circle Graph for Competitor Analysis – Insight into Market Dynamics
#Product/Service Introduction #Market and Competitor Analysis #Graph
-

Modern Theme Pie Chart – Market Share Analysis
#Product/Service Introduction #Market and Competitor Analysis #Graph
-

Clock Shape Circular Diagram – Product and Market Analysis
#Product/Service Introduction #Market and Competitor Analysis #Graph
