Modern Business Plan Template – Visualizing Revenue Projections
RJ0200015_6
- Last Update 04/01/2025
- File Size 5.2MB
- # of Slides 2
- File Format PPTX
- Slide Ratio 16:9
- Color
Keywords
- #Content-Based Slides
- #Design-Based Slides
- #Product/Service Introduction
- #Business Strategy
- #Graph
- #Development Status
- #Financial Outlook & Expected Impact
- #Circles
- #Pie Chart
- #16:9
- #pie chart PowerPoint slide
- #circular graph template
- #ratio comparison chart
- #business performance visualization
- #pie diagram slide template
About the Product
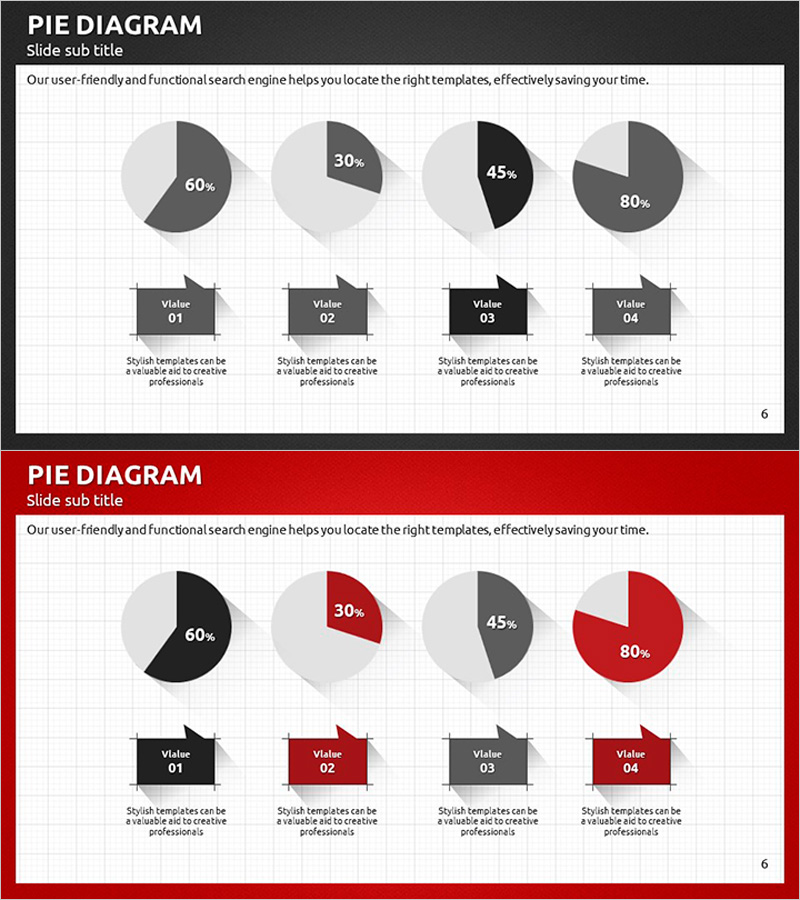
A pie chart PowerPoint slide designed to compare business performance and revenue structure at a glance. This template features two color variations: dark gray and black dual-tone, and dark gray and red dual-tone. Each slide contains four circular pie charts with labeled sections and descriptive text areas below. Percentage values and explanations can be displayed simultaneously, making it ideal for financial reports, business plans, and marketing analysis presentations. Available in 16:9 widescreen PPTX format compatible with all PowerPoint versions. Data values and colors are fully editable to match your specific needs.
Usage Points
-
Main Usage
Optimized for expressing compositional ratios such as financial data, sales percentages, market share, and budget allocation using circular pie charts. The template allows simultaneous comparison of four items with percentage values, making it perfect for revenue projection sections in business plans, quarterly performance reports, and marketing analysis presentations.
-
How to Use
Double-click each pie chart's percentage value to replace it with your actual data, and modify the label text (Value 01–04) to match your item names. Enter detailed descriptions in the text area below each chart to complete the slide. Adjust colors by accessing the shape formatting options and changing the fill color to match your brand palette.
-
Recommended For
Finance professionals, executives, marketing teams, consultants, and business planners preparing quarterly reports, investor presentations, and strategy meeting materials. Particularly suitable for situations requiring ratio-based data visualization such as quarterly performance analysis, budget status updates, and customer composition analysis.
-
Slide Structure
Two-slide layout. Each slide features four pie charts (approximately 120px diameter) arranged in a 2×2 grid, with label boxes (Value 01–04) and descriptive text areas positioned below each chart. The first slide uses dark gray and black dual-tone coloring, while the second slide features dark gray and red dual-tone coloring for visual variety.
Related Products
-

Development Status Pie Chart – Visualizing Market Share
#Product/Service Introduction #Market and Competitor Analysis #Graph
-

3D Circle Graph for Competitor Analysis – Insight into Market Dynamics
#Product/Service Introduction #Market and Competitor Analysis #Graph
-

Brand Awareness Distribution Chart – Market Share Analysis
#Product/Service Introduction #Market and Competitor Analysis #Graph
-

Market Share Analysis Graph & Table – Enhancing Understanding through Data Visualization
#Product/Service Introduction #Market and Competitor Analysis #Diagram
