Brown Mixed Graph – Business Introduction and Market Analysis
RJ0900019_15
- Last Update 08/21/2025
- File Size 0.3MB
- # of Slides 2
- File Format PPTX
- Slide Ratio 16:9
- Color
Keywords
About the Product
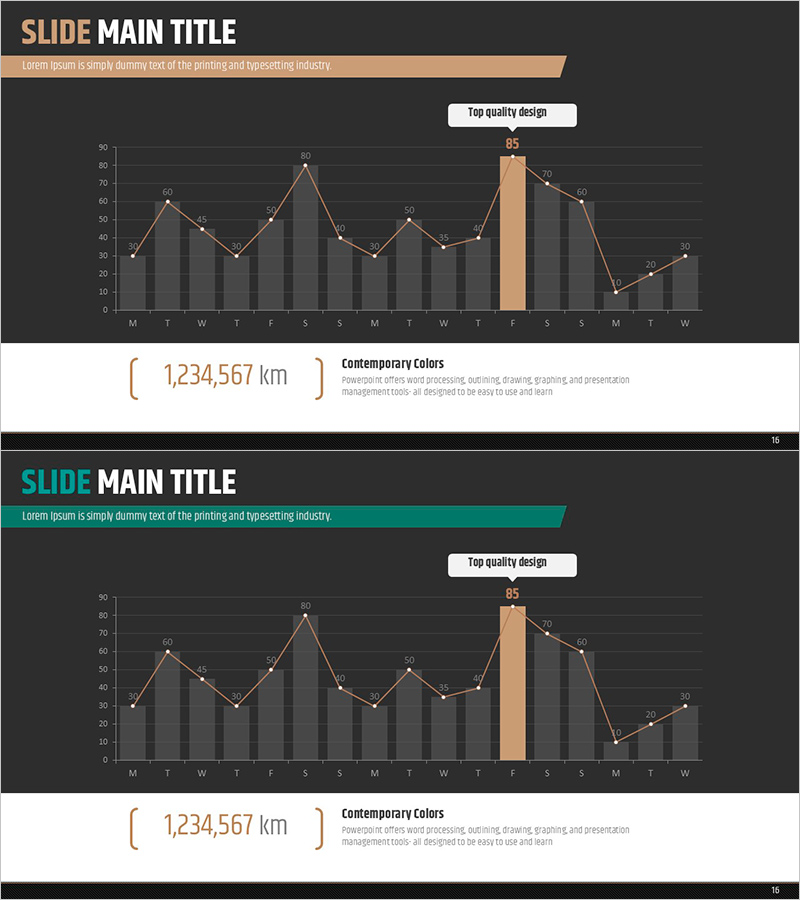
This slide features a brown mixed graph that visually emphasizes business introduction and market analysis. The layout is simple and intuitive, effectively comparing and conveying data and information. The elegant blend of brown and refreshing green instills trust and professionalism. It's suitable for business presentations, investment proposals, and market analysis reports, visually emphasizing essential data points. The template's graph is easy to modify, making it immediately usable for practitioners, with an editing difficulty rated as 'easy'.
Usage Points
-
Main Usage
- This template is designed for business professionals who need to present market analysis and investment proposals clearly and effectively during meetings or conferences.
-
How to Use
- Users can adapt the graphs and data points to fit specific case studies or market conditions, making it suitable for team presentations or client meetings where data-driven decisions are crucial.
-
Recommended For
- Ideal for business analysts, financial advisors, and project managers who require a reliable tool to convey complex information in a straightforward manner during stakeholder engagements.
-
Slide Structure
- The overall flow of the slides includes an introduction to key business metrics, followed by detailed market analysis, and concludes with actionable insights that facilitate strategic discussions.
Related Products
-

Construction Company Debt and Capital Structure Analysis Chart
#Business Introduction #Market and Competitor Analysis #Diagram
-

Mobile App Service Development Status – Doughnut Chart Visualization
#Product/Service Introduction #Business Introduction #Graph
-

Visualizing Product Introduction with App Icon Graph – Innovation and Trends
#Product/Service Introduction #Business Introduction #Graph
-

Growth Curve Area Graph - Market and Competitive Analysis
#Business Strategy #Market and Competitor Analysis #Graph
