Business Area Analysis Donut Chart – Clear Visualization
RM0500003_5
- Last Update 02/20/2025
- File Size 2MB
- # of Slides 2
- File Format PPTX
- Slide Ratio 16:9
- Color
Keywords
- #Content-Based Slides
- #Design-Based Slides
- #Product/Service Introduction
- #Business Introduction
- #Graph
- #Development Status
- #Business Areas
- #Circles
- #Doughnut Chart
- #16:9
- #donut chart PowerPoint
- #donut graph slide template
- #business area analysis presentation
- #ratio visualization chart
- #PowerPoint graph slide design
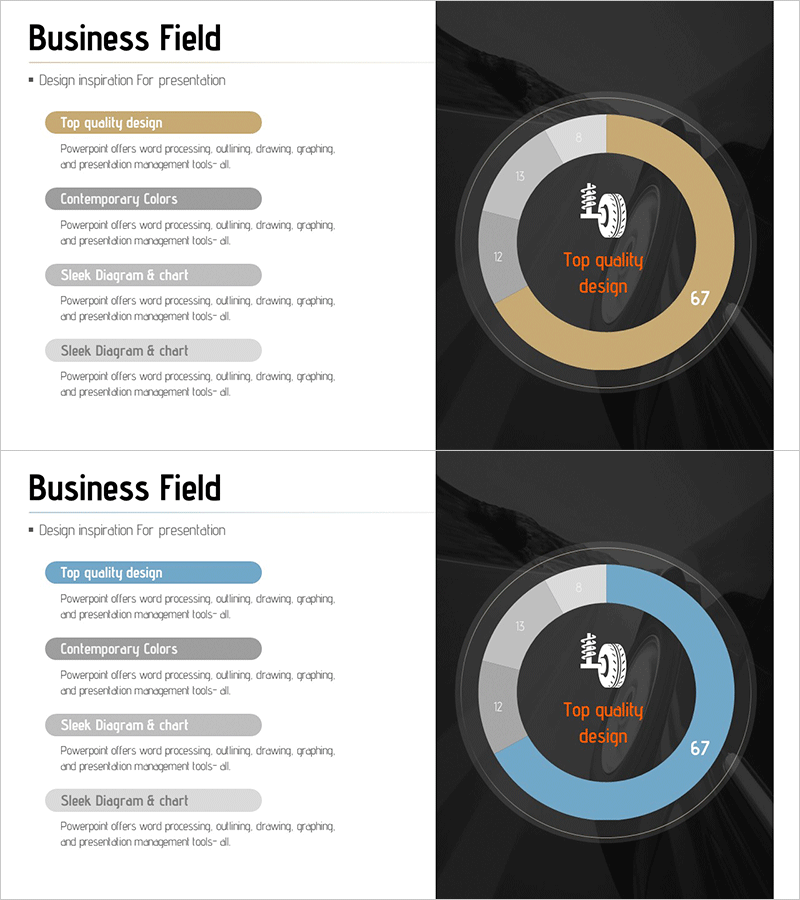
About the Product
A donut chart PowerPoint slide designed for business area analysis and portfolio visualization. The template features a central circular area for key messages and an outer donut ring displaying two-segment ratio data, making it ideal for executive reports, strategic presentations, and business portfolio analysis. Available in gold and blue color schemes with 16:9 widescreen format in PPTX, fully editable for immediate use. This slide template transforms complex business metrics into intuitive visual representations for stakeholder communication.
Usage Points
-
Main Usage
Visualize business segment ratios and composition at a glance using a donut chart format, ideal for executive reports and strategy meetings where key metrics need emphasis. The central circular area accommodates core messages or numerical data to maximize visual impact.
-
How to Use
Open the slide and replace the donut chart colors and central text with your data. Perfect for comparing business division revenue, market share, or portfolio composition across two categories. Ready to use in executive meetings, investor presentations, and quarterly performance reviews with minimal customization.
-
Recommended For
Recommended for executives, business planners, marketing managers, and financial analysts presenting business performance, market analysis, and portfolio status. Particularly effective in executive reports, quarterly performance presentations, and investor pitch decks where ratio-based data requires emphasis.
-
Slide Structure
Two-slide set, each featuring a central circular area for key messages and numerical data, with an outer donut ring representing two-segment ratio visualization. Includes both gold and blue color scheme versions, formatted in 16:9 widescreen ratio optimized for modern presentation environments.
Related Products
-

Construction Business Analysis Donut Chart
#Product/Service Introduction #Business Introduction #Diagram
-

Business Area Progress Analysis Circle Graph – Simple and Stylish
#Product/Service Introduction #Business Introduction #Diagram
-

Cement Theme Development Status Graph – Market Share Analysis
#Product/Service Introduction #Market and Competitor Analysis #Graph
-

Development Status Donut-Shaped Circle Graph – Visualizing Market Share
#Product/Service Introduction #Market and Competitor Analysis #Graph
