Construction Business Estimated Income Report – Effective Diagram for Financial Performance
RM0500004_25
- Last Update 02/20/2025
- File Size 1.4MB
- # of Slides 2
- File Format PPTX
- Slide Ratio 16:9
- Color
Keywords
- #Content-Based Slides
- #Design-Based Slides
- #Financial Plans and Performance
- #Diagram
- #Income Statement
- #Sales and Revenue
- #Table
- #16:9
- #income statement PowerPoint slide
- #financial data table presentation
- #construction business income report
- #how to make a financial statement in PowerPoint
- #year-over-year comparison slide
About the Product
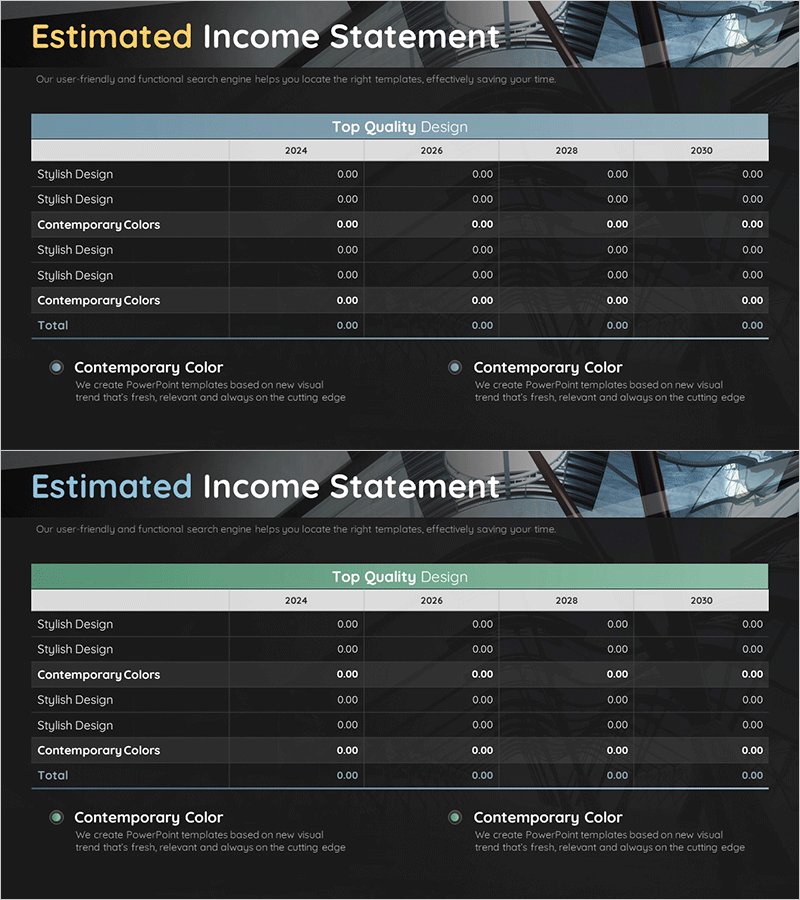
A professional income statement PowerPoint slide optimized for construction business and financial reports. This slide presents a four-year financial performance comparison from 2024 to 2030 in a clear table format. The design features a dark background with light blue header and white text, ensuring excellent readability for numerical data. The layout is structured for easy data entry and is ideal for construction, manufacturing, and finance presentations to effectively communicate financial status and projections.
Usage Points
-
Main Usage
This slide is designed to compare and analyze financial performance data across multiple years and communicate results clearly to investors and stakeholders. The table format organizes income statement line items and numerical values, enabling quick year-over-year trend analysis and financial clarity.
-
How to Use
Use this slide in the financial section of business plans, investment pitch decks, and financial reports. Input actual company financial data into each row (line items) and column (years) to reflect your organization's performance. The dark professional background enhances credibility in financial presentations.
-
Recommended For
Finance directors, CFOs, investor relations (IR) managers, and financial analysts in construction, manufacturing, finance, and consulting sectors. Ideal for business performance reporting, investment pitch presentations, shareholder meetings, and financial institution loan applications.
-
Slide Structure
The slide set includes 2 slides with identical table structures, allowing comparison of multiple financial scenarios or departmental data. Each table contains 7 rows (including headers) and 4 columns (years: 2024, 2026, 2028, 2030), with editable cells for numerical input.
Related Products
-

Sales and Profit Comparison Graph & Table – Clear Financial Analysis
#Financial Plans and Performance #Diagram #Graph
-

Affiliate Business Income Statement – Visualizing Financial Performance
#Financial Plans and Performance #Diagram #Income Statement
-

Sales and Profit Table – Financial Performance Visualization
#Financial Plans and Performance #Diagram #Income Statement
-

Transportation Business Sales and Profit Table – Financial Analysis
#Financial Plans and Performance #Diagram #Income Statement
