Management Performance Analysis Mixed Chart – Data Insights and Strategic Analysis
RM0500004_15
- Last Update 02/20/2025
- File Size 1.4MB
- # of Slides 2
- File Format PPTX
- Slide Ratio 16:9
- Color
Keywords
- #Content-Based Slides
- #Design-Based Slides
- #Business Strategy
- #Market and Competitor Analysis
- #Graph
- #Other
- #Achievements
- #Market Analysis
- #16:9
- #management performance analysis PPT slide
- #mixed chart PowerPoint template
- #bar and line graph slide
- #data analysis chart PowerPoint
- #performance metrics visualization presentation
About the Product
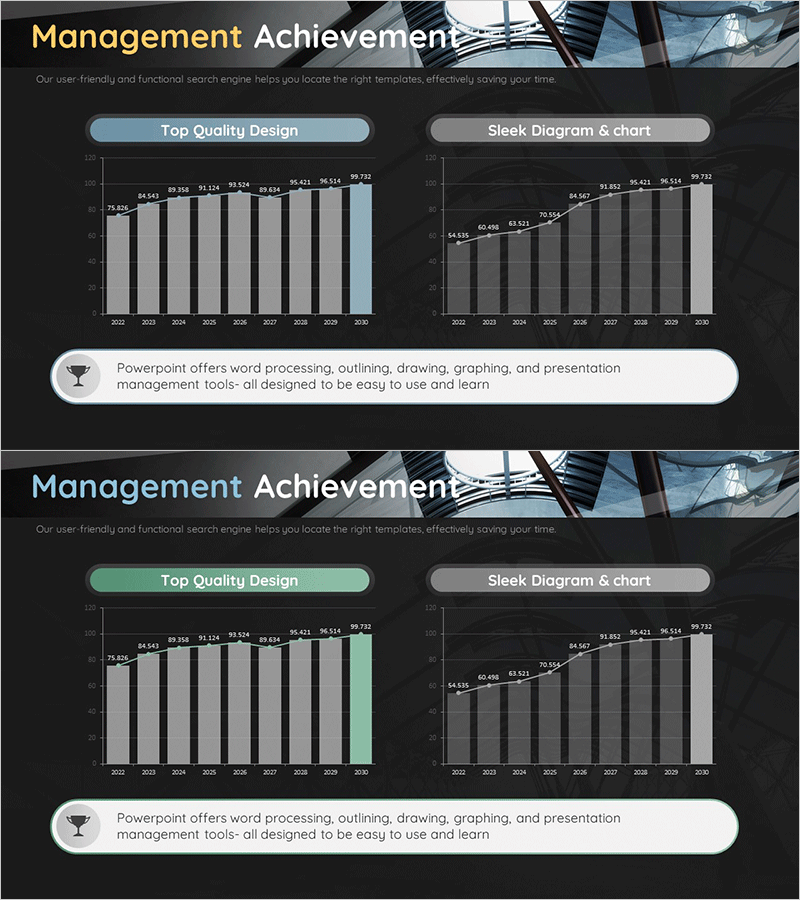
A mixed chart PowerPoint slide that displays management performance and market analysis data side by side with dual visualization. Combines bar graphs and line graphs across two layouts to represent multiple metrics such as revenue, growth rate, and market share simultaneously. Dark background with light blue and gray chart tones creates a professional presentation atmosphere, clearly communicating year-over-year trends and actual vs. target performance. Ready-to-use presentation slide for business performance reports, investor pitches, executive briefings, and strategic planning sessions.
Usage Points
-
Main Usage
Visualizes multi-layered data such as management performance, market analysis, and financial metrics using a combined bar and line graph structure to communicate trends and goal achievement simultaneously. Optimized for year-over-year comparisons, actual vs. target performance, and growth rate analysis.
-
How to Use
Use in business performance reviews, executive meetings, investor IR presentations, quarterly and annual business reports to explain key performance indicators. Left chart represents absolute values (revenue, profit), while right chart shows relative values (growth rate, market share) to strengthen decision-making foundation.
-
Recommended For
CFOs, financial managers, business unit heads, team leaders, business planning teams, investor relations specialists, and consulting analysts requiring data-driven decision making. High utility in quarterly and annual performance analysis, market trend analysis, and business strategy development phases.
-
Slide Structure
Two-slide set. Slide 1 features a light blue accent bar and line mixed chart showing absolute value trends with eight annual data points. Slide 2 uses gray-tone identical structure chart for relative value representation (growth rate, market share). Title input area at top and descriptive text area at bottom on each slide.
Related Products
-

Analysis Graph of Key Performance and Corporate Growth Indicators – Emphasizing Business Achievements
#Business Strategy #Market and Competitor Analysis #Graph
-

Management Performance Analysis Mixed Chart – Visualizing Strategies and Achievements
#Business Strategy #Market and Competitor Analysis #Graph
-

Graph of Major Projects and Success Stories - Business Achievement
#Business Strategy #Market and Competitor Analysis #Graph
-

Eco-friendly Survey Graph – Environmental Protection and Data Utilization
#Business Strategy #Market and Competitor Analysis #Graph
