Graph of Major Projects and Success Stories - Business Achievement
RM0500002_15
- Last Update 02/20/2025
- File Size 1.1MB
- # of Slides 2
- File Format PPTX
- Slide Ratio 16:9
- Color
Keywords
- #Content-Based Slides
- #Design-Based Slides
- #Business Strategy
- #Market and Competitor Analysis
- #Graph
- #Other
- #Achievements
- #Market Analysis
- #16:9
- #management achievement PowerPoint slide
- #business performance chart template
- #dual chart comparison slide
- #quarterly results presentation
- #financial performance PPT design
About the Product
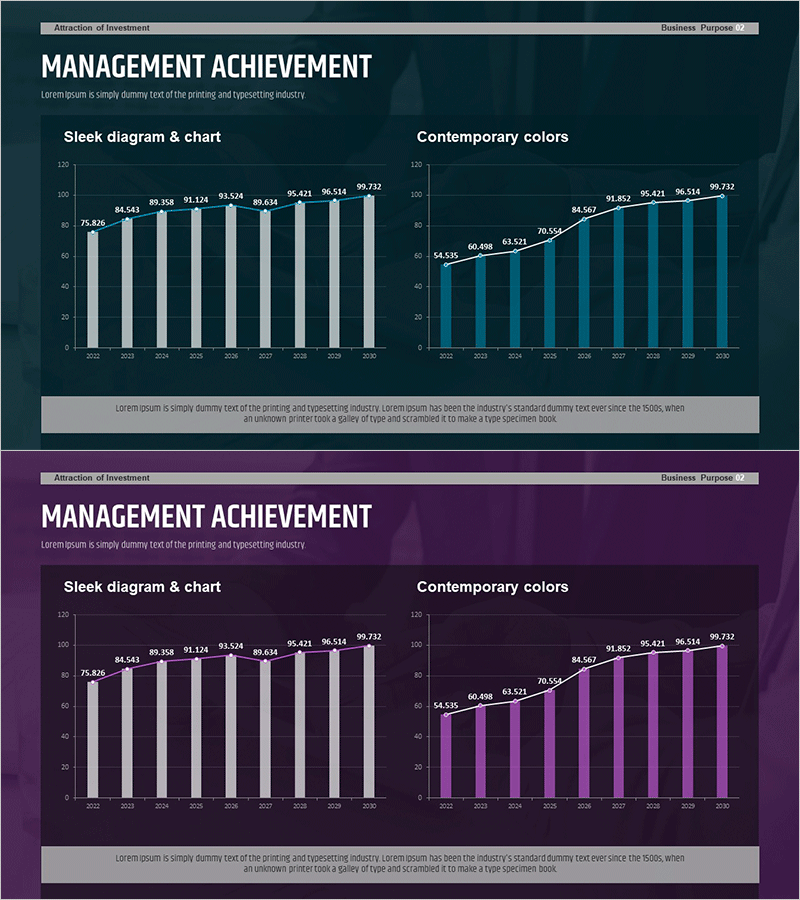
A 2-slide PowerPoint presentation template that visualizes business performance and management goal achievement through side-by-side chart comparison. The left side features a bar chart showing absolute values, while the right side displays a line chart tracking trends over the same period. Dark blue background with white typography and teal accent colors creates a professional presentation aesthetic. Each slide includes a title section, two distinct chart areas with data labels, and a descriptive text box at the bottom. Ready to use for investor presentations, quarterly business reviews, and executive reporting.
Usage Points
-
Main Usage
Present annual or quarterly performance metrics using two complementary visualization methods simultaneously. The bar chart emphasizes absolute value comparisons while the line chart highlights trend progression, enabling stakeholders to grasp both snapshot and trajectory insights.
-
How to Use
Deploy in investor relations presentations, quarterly executive briefings, and public business performance announcements. Edit chart data directly with your actual performance figures, then customize the title and descriptive text to match your document context and audience.
-
Recommended For
CFOs, financial controllers, business development teams, and executive assistants presenting quarterly or annual performance reviews. Particularly effective for investor relations departments explaining financial results and business goal achievement simultaneously.
-
Slide Structure
Each slide contains a title area at the top, a bar chart section on the left (10 data points with value labels), a line chart section on the right (10 data points with trend line), and a descriptive text box at the bottom (2 lines). Both slides maintain identical layout for consistent visual narrative throughout the presentation.
Related Products
-

Management Performance Comparison Analysis Chart – Data-Driven Decision Making
#Business Strategy #Market and Competitor Analysis #Graph
-

Analysis Graph of Key Performance and Corporate Growth Indicators – Emphasizing Business Achievements
#Business Strategy #Market and Competitor Analysis #Graph
-

Management Performance Analysis Mixed Chart – Visualizing Strategies and Achievements
#Business Strategy #Market and Competitor Analysis #Graph
-

Eco-friendly Survey Graph – Environmental Protection and Data Utilization
#Business Strategy #Market and Competitor Analysis #Graph
