Cement Theme Development Status Graph – Market Share Analysis
RJ0300058_21
- Last Update 05/03/2025
- File Size 3MB
- # of Slides 2
- File Format PPTX
- Slide Ratio 16:9
- Color
Keywords
- #Content-Based Slides
- #Design-Based Slides
- #Product/Service Introduction
- #Market and Competitor Analysis
- #Graph
- #Development Status
- #Market Share
- #Circles
- #Doughnut Chart
- #16:9
- #donut chart PowerPoint
- #pie chart slide template
- #ratio analysis presentation
- #market share graph
- #donut graph design
- #data visualization PPT
- #how to create donut chart in PowerPoint
About the Product
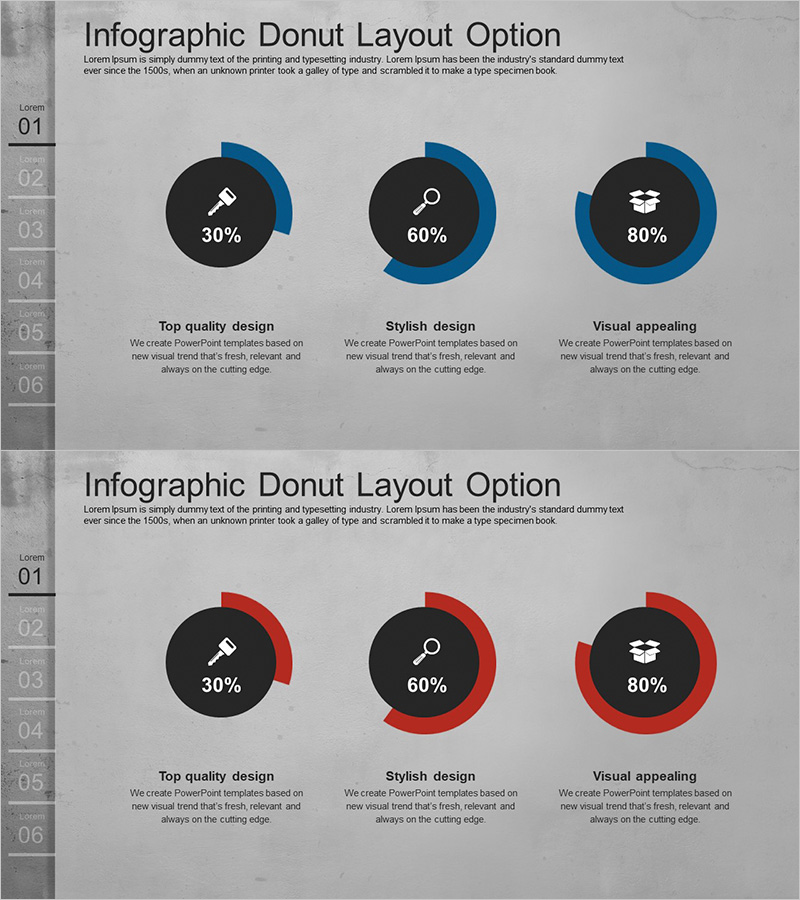
A PowerPoint slide template featuring three donut charts for visualizing market share, development progress, performance comparison, and other ratio-based data. Set against a dark background, blue and red segments create strong visual contrast to emphasize numerical values. Each chart displays percentage figures and icons in the center, enabling instant data comprehension, with descriptive text areas below each item. The 2-slide set offers color-variant layout options to match your presentation tone. Ideal for business reports, performance analysis, market overview presentations, development status updates, and product share explanations—ready to use immediately in professional settings.
Usage Points
-
Main Usage
Visualize ratio, composition, and market share data using donut charts to strengthen quantitative performance analysis and market overview presentations. Central percentage figures and icons deliver key information instantly, while color contrast visually distinguishes item importance.
-
How to Use
Apply to executive reports, business performance presentations, market analysis materials, development status updates, and product share explanations. Simply input item names and descriptions in text areas, update percentage values, and the slide is ready for immediate use.
-
Recommended For
Executives, marketing managers, business development teams, financial analysts, consultants, R&D departments, and professionals presenting quantitative performance and market data. Suitable for quarterly performance reviews, annual business plan presentations, and investor briefings.
-
Slide Structure
2-slide set with three donut charts arranged horizontally on each slide. Each chart displays ratio data with a dark circular background and blue (or red) segments. Center placement of percentage figures and icons, with item names and descriptive text areas positioned below.
Related Products
-

Analysis of Work Progress – Utilizing Pie Chart
#Product/Service Introduction #Market and Competitor Analysis #Graph
-

Stock Market Share Analysis Graph – Insights and Strategies
#Product/Service Introduction #Market and Competitor Analysis #Graph
-

Doughnut Chart Visualizing Current Status of 3D Printing Technology Development
#Product/Service Introduction #Market and Competitor Analysis #Graph
-

Analysis of Transportation Usage Status – Pie Chart
#Product/Service Introduction #Market and Competitor Analysis #Graph
