Competitor Automotive Technology Analysis – Diagram Bridging Market and Technology
RM0500003_13
- Last Update 02/20/2025
- File Size 0.6MB
- # of Slides 2
- File Format PPTX
- Slide Ratio 16:9
- Color
Keywords
- #Content-Based Slides
- #Design-Based Slides
- #Market and Competitor Analysis
- #Diagram
- #Competitor Analysis
- #Cluster
- #Table
- #Closed Cluster Diagram
- #16:9
- #closed cluster diagram PowerPoint
- #3-node diagram template
- #competitor analysis slide
- #market technology comparison PPT
- #cluster diagram PowerPoint slide
About the Product
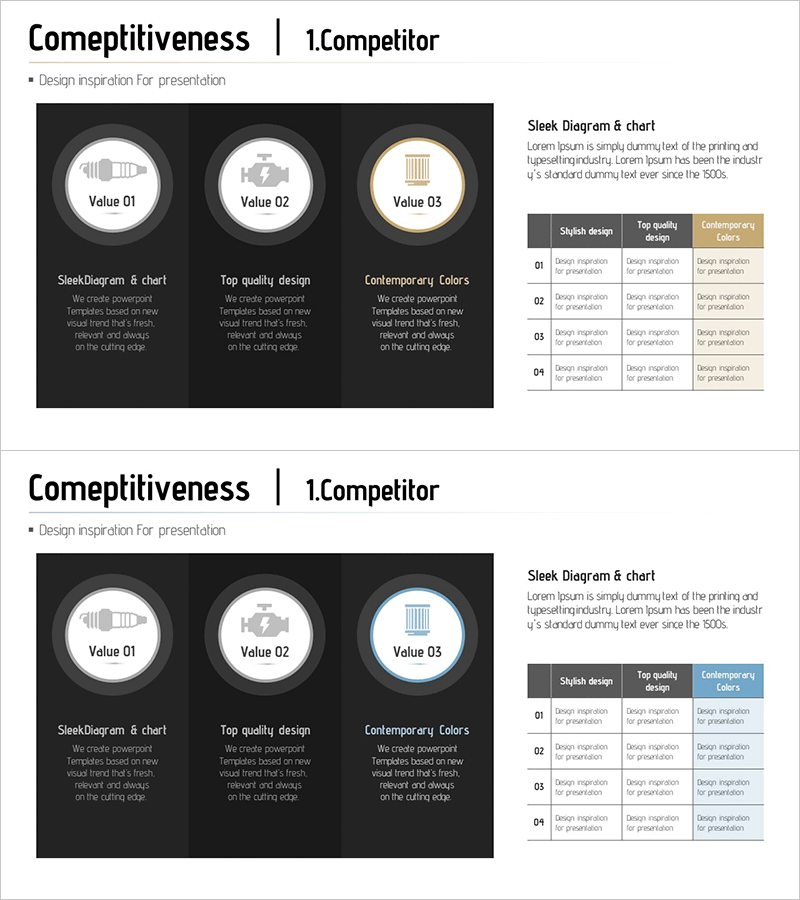
A 3-node closed cluster diagram PowerPoint slide designed for competitor analysis and market-technology comparison. Three value nodes (Value 01, 02, 03) are arranged in a circular closed structure around a central concept, with detailed descriptions and a comparison table below. Dark background with white typography and gold accent colors creates a premium presentation aesthetic. Ideal for automotive technology, market analysis, and competitive strategy presentations across industries. All text and colors are fully editable for immediate customization.
Usage Points
-
Main Usage
Visualizes relationships and comparisons among three key elements such as competitor profiles, technology features, or market characteristics. The closed circular structure emphasizes interconnection and integration of the three value nodes around a central concept.
-
How to Use
Enter competitor names, technology types, or market attributes into each node (Value 01, 02, 03), and populate the comparison table below with detailed analysis. Customize colors and text freely to adapt to automotive, IT, finance, or other industry presentations.
-
Recommended For
Ideal for executives, strategy teams, marketing departments, and R&D teams presenting competitor analysis, technology benchmarking, or market strategy. Effective for B2B presentations, investor pitches, and competitive intelligence reports in automotive, technology, finance, and manufacturing sectors.
-
Slide Structure
2-slide deck. Slide 1: Three-node closed cluster diagram with circular node arrangement and descriptive text for each node. Slide 2: 3-row by 4-column comparison table with category headers and detailed information columns. 16:9 widescreen format, PPTX file type.
Related Products
-

Competitor Comparison Analysis Table – Visualizing Market Analysis
#Market and Competitor Analysis #Diagram #Graph
-

Clustered Vertical Bar Graph Slide – Visualizing Market Analysis
#Market and Competitor Analysis #Diagram #Graph
-

Card Competitor Comparison Slide Template – Competitive Advantage Analysis
#Market and Competitor Analysis #Diagram #Competitor Analysis
-

Concise Analysis Column Graph & Table Slide
#Market and Competitor Analysis #Diagram #Graph
