Financial Services Revenue Analysis Table – Intuitive Financial Data Visualization
RJ0400057_24
- Last Update 06/02/2025
- File Size 0.9MB
- # of Slides 2
- File Format PPTX
- Slide Ratio 16:9
- Color
Keywords
- #Content-Based Slides
- #Design-Based Slides
- #Financial Plans and Performance
- #Diagram
- #Sales and Revenue
- #Key Financial Indicators
- #Cluster
- #Table
- #Closed Cluster Diagram
- #16:9
- #table diagram PowerPoint
- #financial data visualization slide
- #revenue analysis template
- #financial comparison chart PPT
- #data table presentation template
About the Product
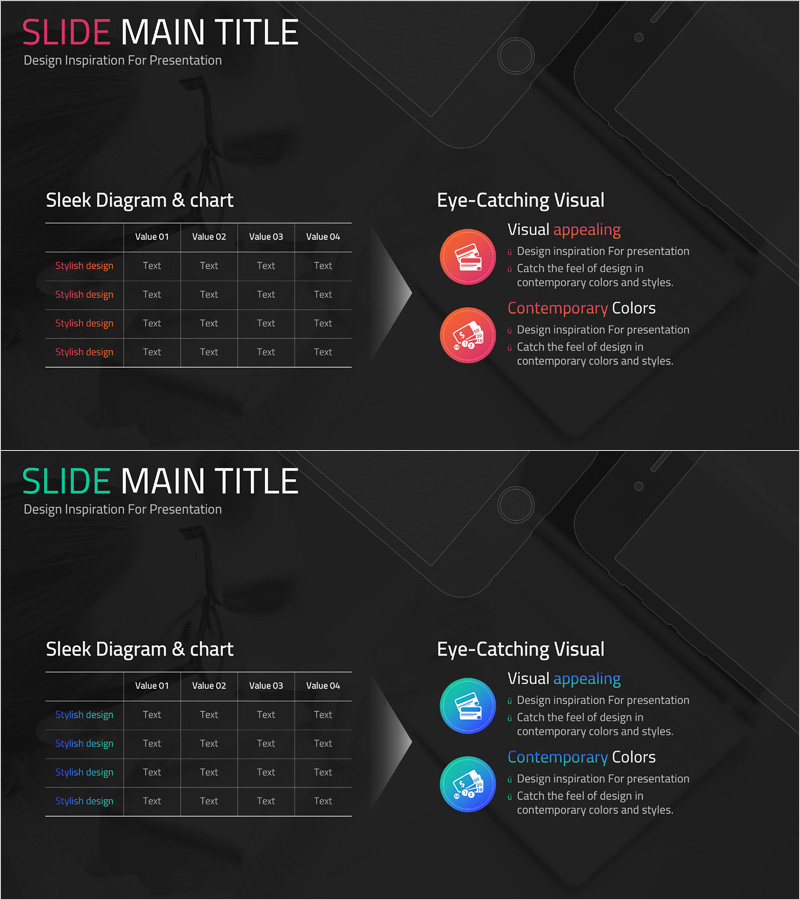
A table-format diagram PowerPoint slide designed for financial services revenue analysis. The layout enables side-by-side comparison of four data columns with clear visual hierarchy. Dark background combined with white typography and accent colors (red, green, blue) enhances data readability and financial information clarity. Each row includes a 'Stylish design' label for easy category classification, making it immediately applicable to financial reports, investor presentations, and revenue analysis decks. The 2-slide set accommodates multiple data scenarios.
Usage Points
-
Main Usage
Presents quantitative financial data—revenue status, quarterly performance, product-line sales—in tabular format for clear comparison and analysis. Simultaneous display of multiple metrics strengthens decision-making evidence and stakeholder confidence.
-
How to Use
Deploy in financial analysis sections, investor presentations, quarterly earnings reports, and business planning phases. Replace 'Stylish design' row labels with actual categories (product names, regions, departments), then populate Value 01–04 cells with numerical data.
-
Recommended For
Finance and accounting professionals, investment relations (IR) specialists, executives preparing performance reports, and business analysts presenting quantitative findings. Ideal for any presentation requiring data-driven justification.
-
Slide Structure
2-slide set. Each slide features a 4-column (Value 01–04) × 4-row table layout with header row for item names and data rows containing 'Stylish design' labels and text input areas. Right side includes two circular icons with text description zones for highlighting key insights.
Related Products
-

Sales and Profit Table – Statistical Financial Performance
#Financial Plans and Performance #Diagram #Sales and Revenue
-

Business Profit Analysis Table – Financial Performance and Strategy Analysis
#Financial Plans and Performance #Diagram #Sales and Revenue
-

Key Financial Indicators by Year – Insights for Financial Analysis
#Financial Plans and Performance #Diagram #Sales and Revenue
-

Business Goals Sales and Profits – Strategic Diagram Design
#Business Vision and Strategy #Financial Plans and Performance #Diagram
