Liquidity Management and Cash Flow Forecasting Table – Clear Balance Sheet Reflecting Financial Performance
RM0500002_26
- Last Update 02/20/2025
- File Size 1.1MB
- # of Slides 2
- File Format PPTX
- Slide Ratio 16:9
- Color
Keywords
- #Content-Based Slides
- #Design-Based Slides
- #Financial Plans and Performance
- #Diagram
- #Balance Sheet
- #Key Financial Indicators
- #Table
- #16:9
- #balance sheet PPT slide
- #financial table PowerPoint
- #cash flow forecast slide
- #financial performance table
- #liquidity management PPT
- #financial data comparison slide
About the Product
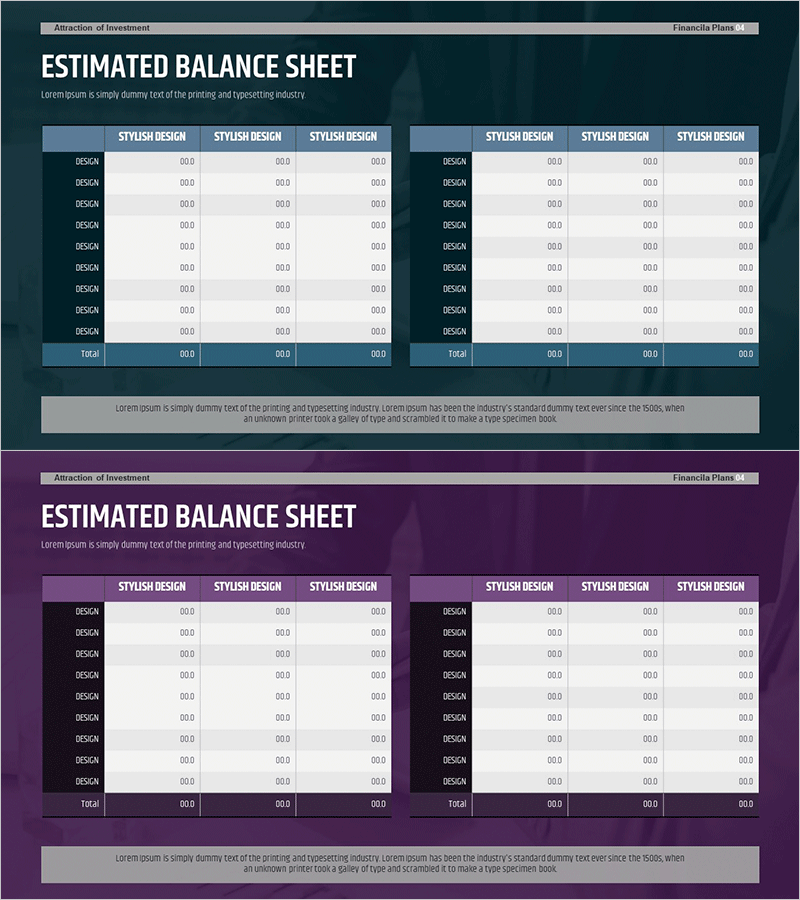
A professional balance sheet PowerPoint slide that clearly visualizes financial performance across multiple periods. This 2-slide set features a dark teal background with white headers and light gray data rows, arranged in a left-right two-column layout for side-by-side comparison of financial metrics by period and category. Each table includes 9 data entry rows plus a total row, making it immediately ready for use in financial planning, cash flow forecasting, and liquidity management presentations.
Usage Points
-
Main Usage
Communicate financial performance analysis and cash flow forecasting through data-driven visuals. The structured balance sheet table presents assets, liabilities, and equity in a format that builds investor and stakeholder confidence in financial health.
-
How to Use
Use in the financial section of investor presentations, business plans, and financial reports to compare metrics across periods. Enter actual financial figures into the two-column tables to highlight period-over-period changes and trends, supporting data-driven decision-making.
-
Recommended For
CFOs, finance managers, and executives presenting financial performance; ideal for investment pitches, bank loan applications, and shareholder meetings. Suitable for startups, SMEs, and large enterprises alike.
-
Slide Structure
Two-slide set with each slide containing 3 columns (period/category classification) and 9 data rows plus 1 total row. Dark teal headers with white text and light gray data rows ensure readability and professional appearance.
Related Products
-

Application Development Business Balance Sheet – Stylish Financial Presentation
#Financial Plans and Performance #Diagram #Other
-

Triangle Pattern PPT Table Chart – Visualizing Financial Performance
#Financial Plans and Performance #Diagram #Balance Sheet
-

Balance Sheet Table Chart – Visualizing Financial Plans and Performance
#Financial Plans and Performance #Diagram #Balance Sheet
-

Green Brown Statistics Table – Financial Performance Analysis
#Financial Plans and Performance #Diagram #Balance Sheet
