Agricultural Competitor Analysis Horizontal Bar Chart
RJ0600033_17
- Last Update 06/29/2025
- File Size 1.4MB
- # of Slides 2
- File Format PPTX
- Slide Ratio 16:9
- Color
Keywords
- #Content-Based Slides
- #Design-Based Slides
- #Market and Competitor Analysis
- #Graph
- #Competitor Analysis
- #Competitive Advantage
- #Horizontal Bar
- #Horizontal Bar Chart
- #16:9
- #horizontal bar chart PowerPoint
- #competitor analysis presentation
- #agricultural comparison chart
- #bar graph slide template
- #data visualization PowerPoint
About the Product
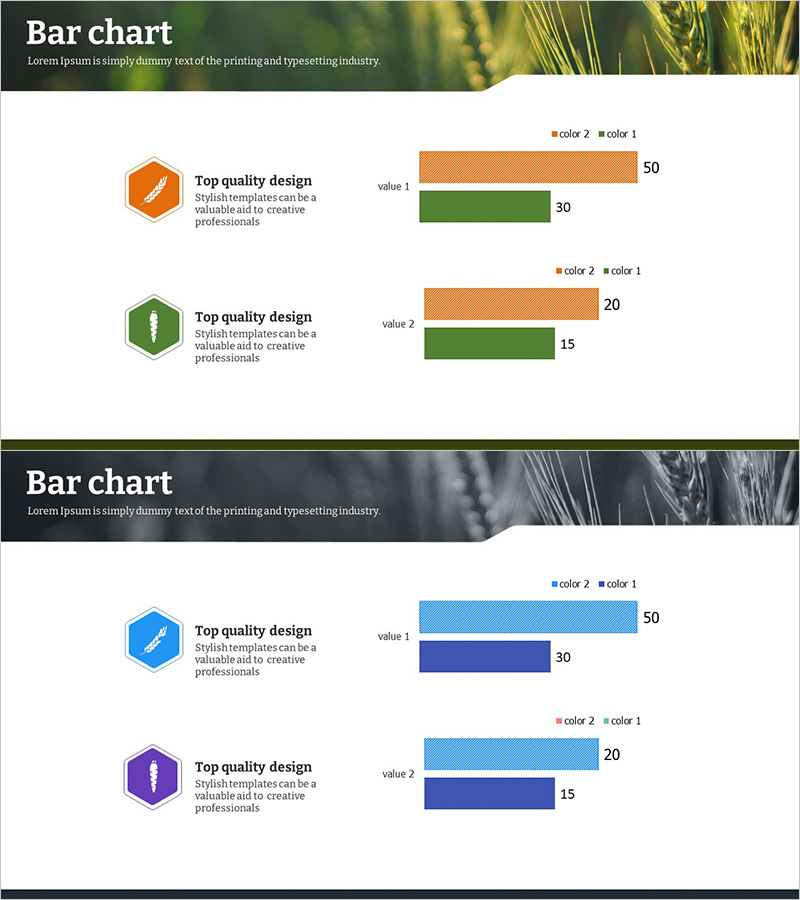
A horizontal bar chart PowerPoint slide designed for agricultural industry competitor analysis. The dual-series chart uses orange and green bars to enable direct performance comparison across competitors. Each slide features hexagonal icons and descriptive text areas to highlight key insights. Formatted in 16:9 widescreen with 2 slides, this presentation template is ready to use and fully editable—simply input your data values and customize the chart for your competitive analysis report.
Usage Points
-
Main Usage
Visualize agricultural industry competitor performance metrics and market analysis. Compare quantitative indicators such as sales volume, productivity, and market share across two competitor categories using dual-series horizontal bars.
-
How to Use
Replace the bar lengths and numerical values with your own data. Edit the competitor names and analysis criteria in the text fields next to the hexagonal icons, and adjust the legend colors as needed for your presentation.
-
Recommended For
Ideal for agricultural company executives, marketing teams, and strategic planning departments presenting competitive benchmarking reports, business plans, and investor pitch decks. Suitable for agribusiness, agricultural machinery, and agricultural technology sector presentations.
-
Slide Structure
2-slide layout with dual-series horizontal bars on each slide. Each slide displays 4 data points (2 bars × 2 series in orange and green). Left-aligned hexagonal icons and title area paired with right-aligned bar chart section in a balanced two-column design.
Related Products
-

Green & Gray Horizontal Bar Chart – Market Analysis and Competitive Edge
#Market and Competitor Analysis #Graph #Competitor Analysis
-

Navy Orange Comparison Bar Graph
#Market and Competitor Analysis #Graph #Competitor Analysis
-

Ticket Sales Graph – Visualizing Competitive Edge
#Market and Competitor Analysis #Graph #Competitor Analysis
-

Horizontal Bar Chart for Competitive Advantage Analysis – Sea Lighthouse
#Market and Competitor Analysis #Diagram #Graph
