Breakdown of Sales Revenue Analysis by Year – Visualize Management Performance
RM0400015_28
- Last Update 02/19/2025
- File Size 0.3MB
- # of Slides 2
- File Format PPTX
- Slide Ratio 16:9
- Color
Keywords
- #Content-Based Slides
- #Design-Based Slides
- #Operational Plan
- #Financial Plans and Performance
- #Diagram
- #Graph
- #Capital Investment Plan
- #Income Statement
- #Table
- #Horizontal Bar
- #Segmented Horizontal Bar
- #16:9
- #stacked bar chart PowerPoint
- #sales revenue analysis slide
- #financial data visualization
- #how to create stacked bar chart in PowerPoint
- #business performance template download
About the Product
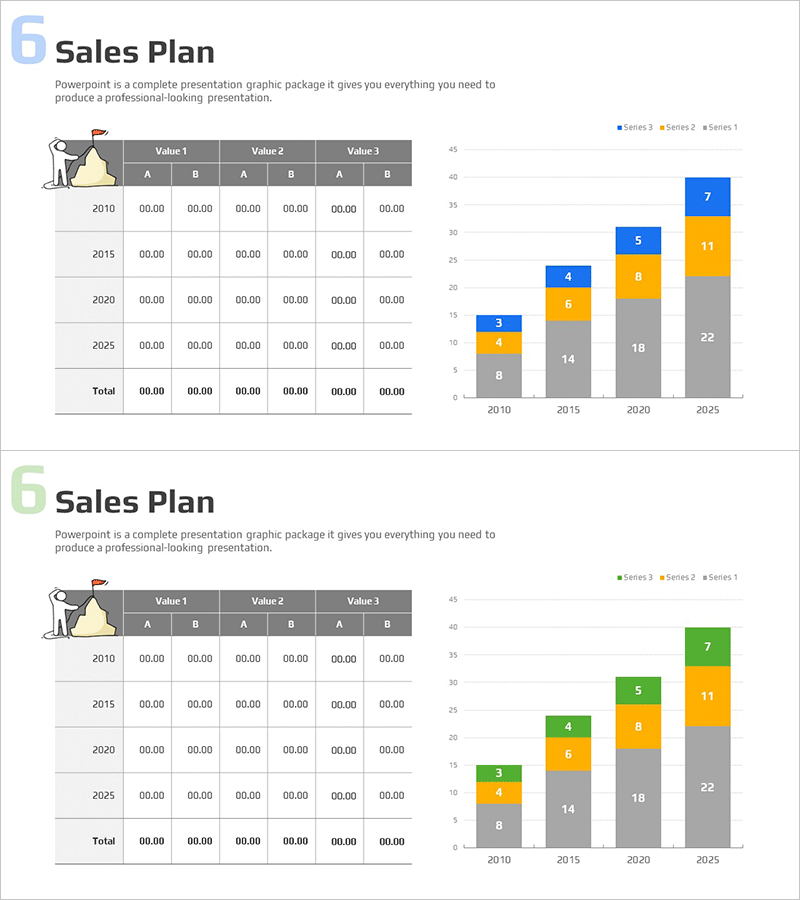
A stacked bar chart PowerPoint slide that visualizes annual sales revenue across four data series from 2010 to 2025. The design combines a data table on the left with a corresponding chart on the right, using blue, orange, and gray color schemes to distinguish between series. Each segment of the stacked bar represents a different value category, allowing viewers to see both individual contributions and total revenue trends at a glance. This slide template is ready to use for financial presentations, business performance reports, quarterly earnings reviews, and management dashboards.
Usage Points
-
Main Usage
Display multi-series revenue data with both absolute values and proportional composition across years. The dual representation of table and stacked bar chart provides both quantitative accuracy and visual impact for stakeholder communication.
-
How to Use
Enter actual revenue figures in the left data table and the right chart updates automatically. Customize year labels, series names, and values to match your data. Color scheme can be easily modified to align with corporate branding. Ready for immediate use in financial reports and investor presentations.
-
Recommended For
Finance directors, CFOs, and business analysts presenting quarterly or annual results. Marketing teams analyzing channel-based revenue, sales teams reporting regional performance, and strategic planning teams showcasing business outcomes across departments.
-
Slide Structure
Two-slide template with color variations. Each slide features a 6-row by 7-column data table on the left (years 2010-2025, three value categories with A/B subdivisions) paired with a stacked bar chart on the right showing four data series with legend and axis labels.
Related Products
-

Weekly Sales Revenue Table – Operations Plan and Financial Performance
#Operational Plan #Financial Plans and Performance #Diagram
-

Business Income Statement – Visualizing Financial Performance
#Financial Plans and Performance #Diagram #Income Statement
-

Payment Service Stock Price Increase Calculation Table Template
#Financial Plans and Performance #Diagram #Income Statement
-

Income Statement Table – Visualization of Financial Performance
#Company Introduction #Financial Plans and Performance #Diagram
