Payment Service Stock Price Increase Calculation Table Template
RJ0300074_24
- Last Update 05/09/2025
- File Size 0.1MB
- # of Slides 2
- File Format PPTX
- Slide Ratio 16:9
- Color
Keywords
- #Content-Based Slides
- #Design-Based Slides
- #Financial Plans and Performance
- #Diagram
- #Income Statement
- #Sales and Revenue
- #Table
- #16:9
- #financial data table PowerPoint
- #comparison table slide design
- #income statement PPT template
- #financial analysis table
- #how to create financial data slides in PowerPoint
About the Product
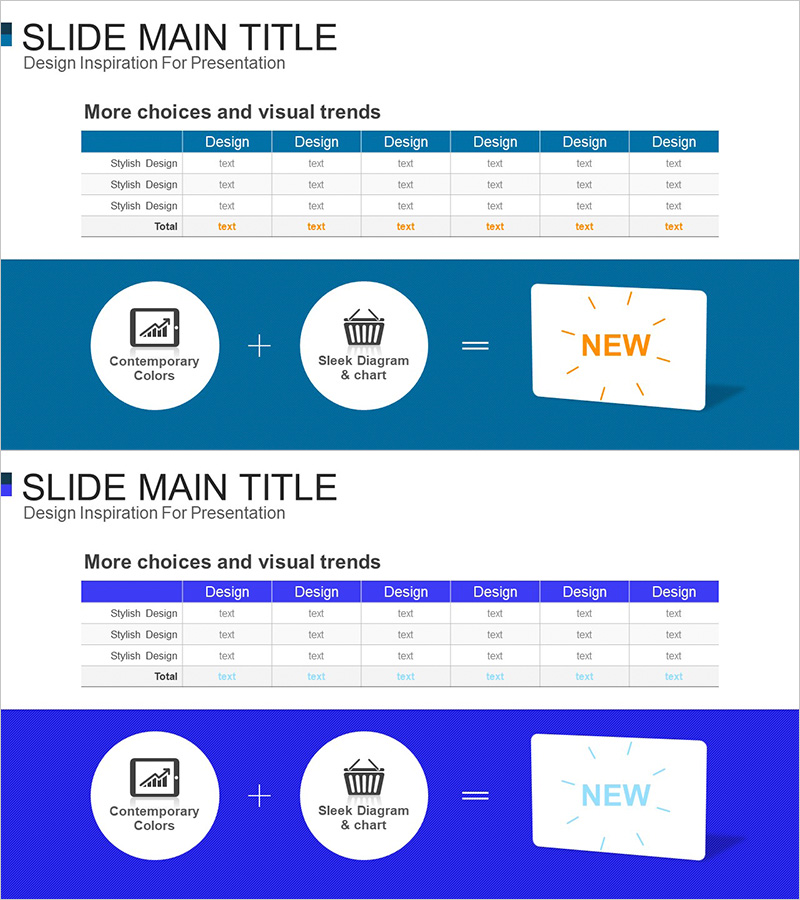
A financial data comparison table PowerPoint slide designed for analyzing payment service stock price increases and financial metrics. Features a dark blue header with white background for clear contrast and effective data presentation. The balanced 6-column grid structure enables simultaneous comparison of multiple financial items including income statements, financial ratios, and return on investment. Includes 2 slides in 16:9 widescreen format ready for immediate use in presentations.
Usage Points
-
Main Usage
Presents financial data and numerical information in clear comparative format. Visualizes payment service metrics, income statements, financial ratios, and ROI across multiple items simultaneously. Ideal for investor relations materials, financial reports, and investment proposals.
-
How to Use
Enter item names in the dark blue header row and input numerical data in the text fields below. The 6-column structure allows parallel comparison of up to 6 items. Add rows for additional data points or modify colors to highlight key metrics. Fully editable for custom financial data.
-
Recommended For
CFOs, financial managers, and investor relations professionals presenting financial performance. Suitable for business plan financial sections, IR deck financial metrics pages, quarterly performance reports, and investment pitch decks requiring data-driven decision support.
-
Slide Structure
2-slide set with first slide showing standard 6-column comparison table and second slide featuring highlighted row variation. Each slide contains 1 header row plus 3 data rows with clearly defined text input areas for seamless data entry.
Related Products
-

Sales and Profit Table Diagram
#Financial Plans and Performance #Diagram #Income Statement
-

Sales and Profit Table – Financial Performance Visualization
#Financial Plans and Performance #Diagram #Income Statement
-

Mobile Finance Business Sales and Profit Statement – Transparent Financial Performance
#Financial Plans and Performance #Diagram #Income Statement
-

Transportation Business Sales and Profit Table – Financial Analysis
#Financial Plans and Performance #Diagram #Income Statement
