Weekly Sales Revenue Table – Operations Plan and Financial Performance
RM0400014_28
- Last Update 02/19/2025
- File Size 0.2MB
- # of Slides 2
- File Format PPTX
- Slide Ratio 16:9
- Color
Keywords
- #Content-Based Slides
- #Design-Based Slides
- #Operational Plan
- #Financial Plans and Performance
- #Diagram
- #Capital Investment Plan
- #Income Statement
- #Table
- #16:9
- #weekly sales revenue table
- #financial data PowerPoint slide
- #sales performance presentation
- #operations plan table slide
- #financial report template
About the Product
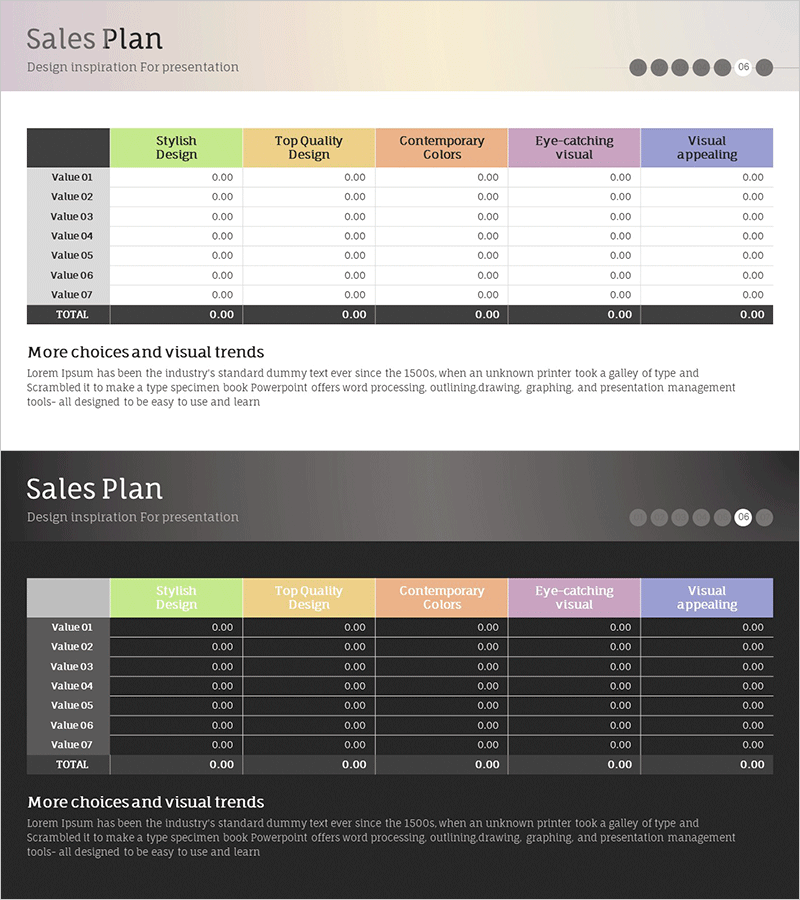
A financial data table PowerPoint slide that displays weekly sales revenue performance at a glance. Set against a light beige background with multi-color headers in green, yellow, pink, and purple, this layout enables comparative analysis across 7 items (Value 01–07) and 6 evaluation metrics (Stylish Design, Top Quality Design, Contemporary Colors, Eye-catching Visual, Visual Appeal). The 2-slide set includes both light and dark tone designs optimized for 16:9 widescreen format. Instantly applicable to operations plan and financial performance presentations, business analysis reports, and executive briefings.
Usage Points
-
Main Usage
Visualizes weekly sales revenue and financial performance metrics in numeric format for clear communication to executives, investors, and team members. Compares 6 evaluation metrics across 7 items in table format, providing quantitative evidence for decision-making and demonstrating operational plan execution results.
-
How to Use
Insert into the financial performance section of business plans, financial reports, and quarterly performance presentations. Enter actual revenue data into Value 01–07 rows and input corresponding figures for each evaluation metric (Design, Quality, Colors, Visual, Appeal). Choose between light or dark tone design based on your document's overall aesthetic.
-
Recommended For
CFOs, financial analysts, business managers, and executives reporting quarterly or monthly financial performance. Particularly valuable for investment pitch decks, shareholder reports, and internal management meetings where objective revenue presentation is essential.
-
Slide Structure
2-slide set featuring light beige and dark gray background versions. Each slide contains a 7-row (Value 01–07, TOTAL) × 6-column (Design, Quality, Colors, Visual, Appeal, blank) table structure with 42 editable text fields (7×6) for detailed financial data entry and analysis.
Related Products
-

Breakdown of Sales Revenue Analysis by Year – Visualize Management Performance
#Operational Plan #Financial Plans and Performance #Diagram
-

Sales and Profit Calculation Table – Efficient Profit Management
#Financial Plans and Performance #Diagram #Income Statement
-

Visualizing Financial Performance with Business Table Chart – Intuitive and Effective
#Financial Plans and Performance #Diagram #Income Statement
-

Payment Service Stock Price Increase Calculation Table Template
#Financial Plans and Performance #Diagram #Income Statement
