New Product Market Entry Strategy Slide by Year – Business Strategy
RM0400014_22
- Last Update 10/01/2025
- File Size 0.2MB
- # of Slides 2
- File Format PPTX
- Slide Ratio 16:9
- Color
Keywords
- #Content-Based Slides
- #Design-Based Slides
- #Business Vision and Strategy
- #Marketing Plan and Strategy
- #Diagram
- #Business Strategy
- #Marketing Strategy
- #Flow
- #Linear Flow
- #16:9
- #linear diagram PowerPoint
- #timeline slide template
- #6-stage process diagram
- #new product market entry strategy PPT
- #business strategy slide
- #phased workflow diagram
About the Product
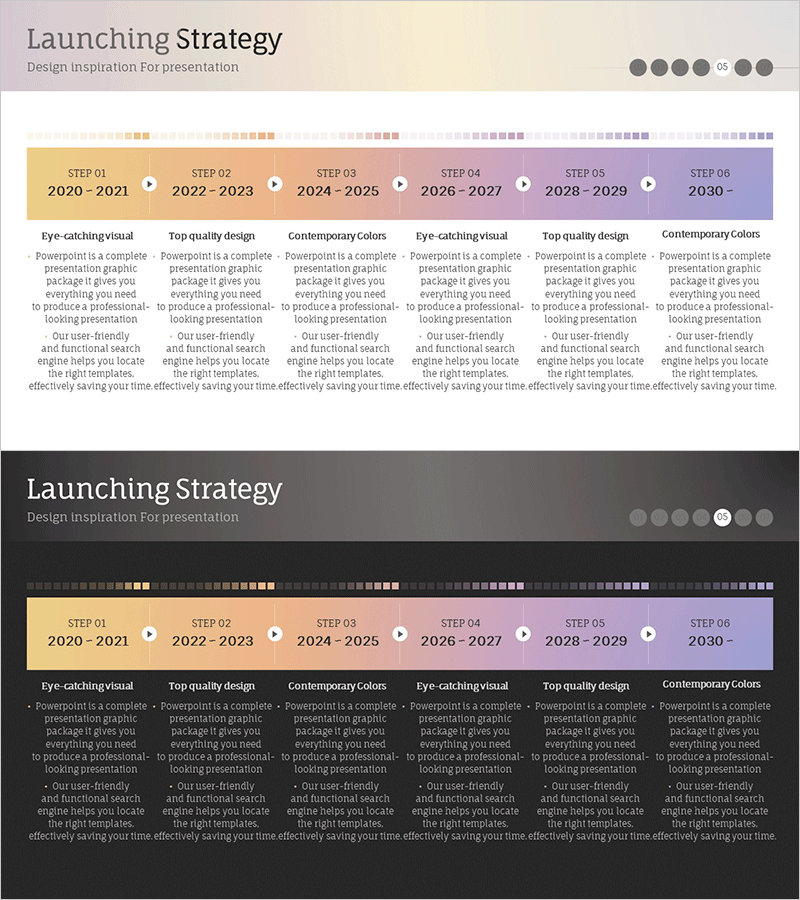
A linear timeline diagram PowerPoint slide that visualizes the market entry stages of a new product across six consecutive years. Six boxes connected sequentially with a gradient transition from yellow to purple represent each phase, clearly displaying key strategic elements (Eye-catching visual, Top quality design, Contemporary Colors) at every stage. The arrow-connected process flow effectively communicates phased business progress and marketing strategy implementation during presentations on business vision and strategic planning. Provided in a 2-slide 16:9 widescreen format, the slide allows free editing of text and icons for immediate application to various business strategy presentations and corporate communications.
Usage Points
-
Main Usage
Clearly visualize the phased roadmap of new product launch strategy to effectively communicate business direction to executives and team members. Simultaneously express six annual milestones and key strategic elements at each stage, enhancing understanding of long-term business planning.
-
How to Use
Use in business strategy presentations, new product launch planning meetings, marketing strategy reports, and investor pitch decks within the strategy section. Edit the text and icons in each box to input actual project phase names, responsible departments, and objectives for immediate deployment.
-
Recommended For
Business planning teams, marketing managers, new business development departments, and executives presenting medium to long-term business plans and new product market entry strategies. Ideal for startup pitches, corporate strategy meetings, and business performance reports where phased progress needs clear visualization.
-
Slide Structure
A linear timeline structure composed of six connected boxes representing consecutive years (2020-2021, 2022-2023, 2024-2025, 2026-2027, 2028-2029, 2030-). Each box features a gradient background transitioning from yellow to purple, with arrows connecting stages to show progression. Below each stage are three lines of descriptive text areas for detailed strategy element input.
Related Products
-

Presentation Slide for Differentiated Marketing Launch Strategy
#Business Vision and Strategy #Marketing Plan and Strategy #Diagram
-

Sleek Diagrams and Charts – Optimal Design Strategies
#Business Vision and Strategy #Marketing Plan and Strategy #Diagram
-

Infographic Slide Visualizing Step-by-Step Process
#Business Vision and Strategy #Marketing Plan and Strategy #Diagram
-

Blood Donation Marketing Strategy Diagram – Effective Data Visualization
#Business Vision and Strategy #Marketing Plan and Strategy #Diagram
