Competitor and Customer Analysis Horizontal Bar Graph and Table
RJ0600023_13
- Last Update 06/26/2025
- File Size 0.4MB
- # of Slides 2
- File Format PPTX
- Slide Ratio 16:9
- Color
Keywords
- #Content-Based Slides
- #Design-Based Slides
- #Market and Competitor Analysis
- #Diagram
- #Graph
- #Competitor Analysis
- #Market Analysis
- #Table
- #Horizontal Bar
- #Standard Table
- #Horizontal Bar Chart
- #16:9
- #horizontal bar chart PowerPoint
- #competitor analysis presentation
- #customer analysis slide
- #bar chart table template
- #market analysis PowerPoint slide
About the Product
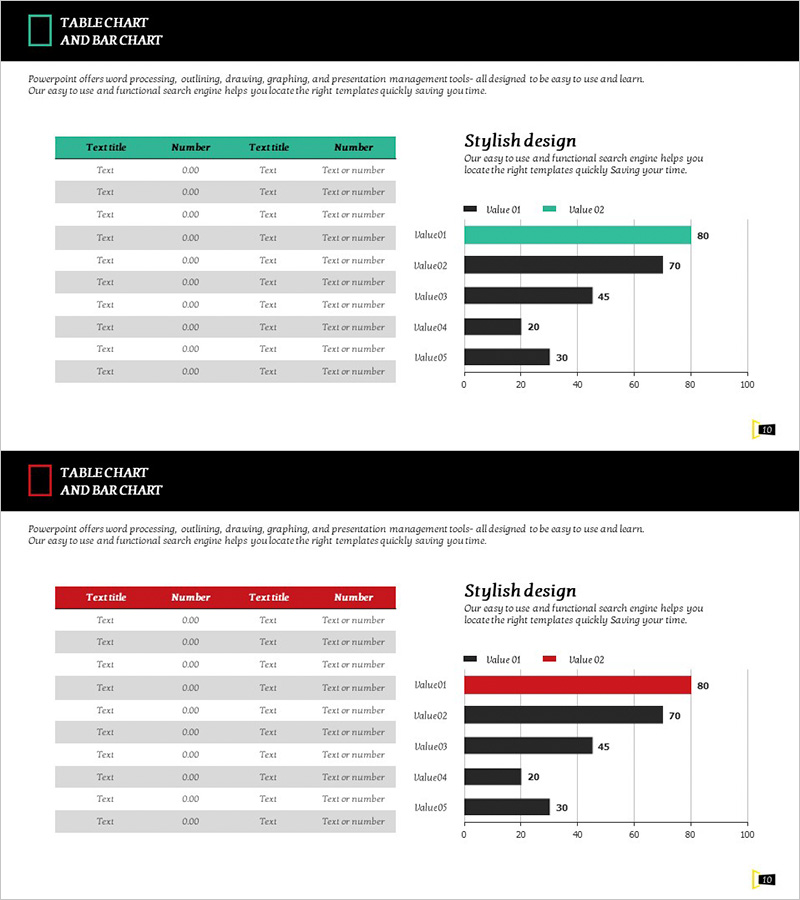
A comprehensive PowerPoint slide set combining horizontal bar charts and data tables for competitive and customer analysis. The first slide features a 5-item horizontal bar chart with dual-series comparison in black and teal colors, enabling clear visualization of competitive positioning. The second slide presents a structured data table with aligned text and numerical values for detailed information display. Delivered in 16:9 widescreen PPTX format with full editability, this template is ideal for market analysis presentations, strategic planning sessions, investor pitches, and executive briefings.
Usage Points
-
Main Usage
This slide set enables data-driven comparison of competitor and customer metrics through visual and tabular formats. The horizontal bar chart intuitively displays relative magnitudes across multiple categories, while the table provides precise figures and supplementary details. Ideal for business strategy development, market entry assessment, and competitive advantage analysis.
-
How to Use
Input competitor, company, and customer segment metrics (revenue, market share, satisfaction scores, etc.) into the first slide's bar chart. Populate the second slide's table with detailed supporting data to complement the chart visualization. Colors, values, and category labels are fully customizable to match your presentation context and data structure.
-
Recommended For
Strategy planners, marketing managers, business development professionals, investor relations teams, and management consultants presenting competitive analysis and market positioning. Suitable for business plans, marketing strategies, investor presentations, and executive reports.
-
Slide Structure
Slide 1: 5-item horizontal bar chart with dual-series (black and teal), 0–100 scale with gridlines. Slide 2: 4-column × 9-row data table with teal header row and alternating white/gray data rows. Both slides include title area and descriptive text space.
Related Products
-

Sugar Content Analysis Bar Graph Table
#Market and Competitor Analysis #Diagram #Graph
-

Stylish Bar Chart Slide Design
#Market and Competitor Analysis #Diagram #Graph
-

Blue Green Horizontal Bar Graph – Optimized for Market and Competitive Analysis
#Market and Competitor Analysis #Diagram #Graph
-

Cement Theme Bar Graph & Table
#Market and Competitor Analysis #Diagram #Graph
