Market Segmentation Closed Diagram – Data-Driven Insights
RM0400013_7
- Last Update 02/18/2025
- File Size 0.6MB
- # of Slides 2
- File Format PPTX
- Slide Ratio 16:9
- Color
Keywords
- #Content-Based Slides
- #Design-Based Slides
- #Product/Service Introduction
- #Market and Competitor Analysis
- #Diagram
- #Composition
- #Market Analysis
- #Cluster
- #Closed Cluster Diagram
- #16:9
- #market segmentation diagram
- #closed diagram PowerPoint
- #market analysis slide template
- #competitive analysis PowerPoint
- #4-section comparison diagram
About the Product
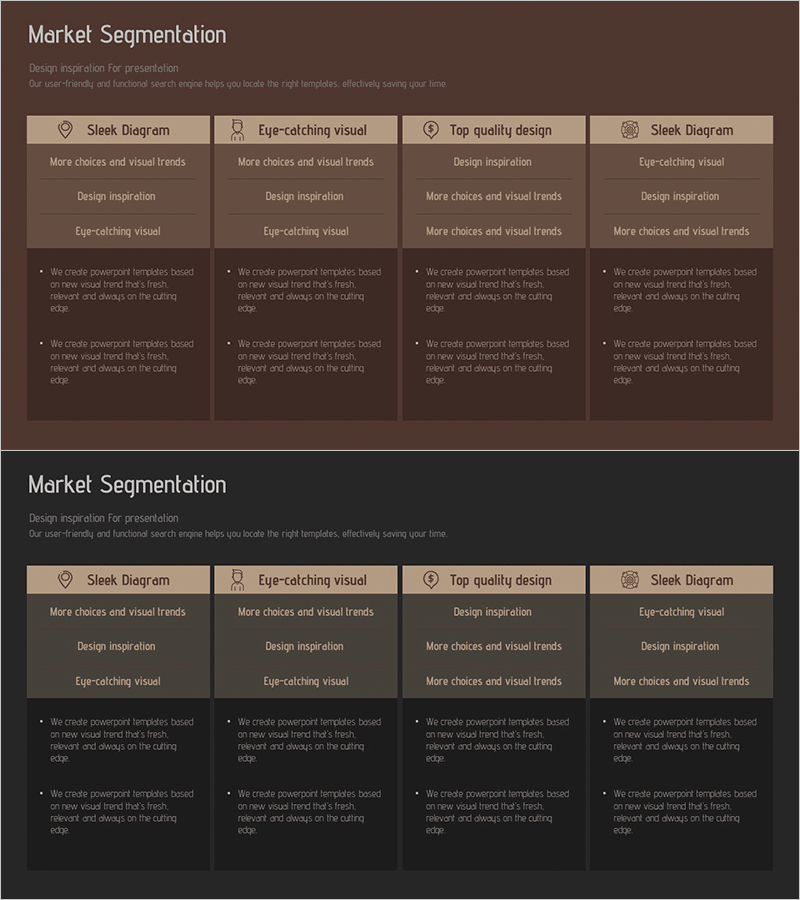
A closed-diagram PowerPoint slide template designed for market segmentation analysis. Four independent sections are arranged in parallel, enabling side-by-side comparison of each market segment's characteristics. The beige header contrasts with the dark brown background to create clear information hierarchy, while each section features an icon, title, subtitle, and descriptive text for immediate presentation use. The 2-slide set provides layout variations to suit different presentation scenarios and business contexts.
Usage Points
-
Main Usage
Ideal for presenting market segmentation strategy by dividing each segment's characteristics, opportunities, and risks into four distinct sections for comparative analysis. Applicable to competitive analysis, customer classification, product positioning, and other business analysis scenarios requiring systematic information organization.
-
How to Use
Replace the title, subtitle, and descriptive text in each section with your analysis content. Icons can be customized by category, and colors can be adjusted to match your corporate brand. Choose your preferred layout from the two options and insert into your presentation.
-
Recommended For
Marketing professionals, strategy planning teams, and executives presenting market analysis findings. Suitable for new business planning, product launch, customer segmentation strategy presentations, investor relations meetings, and business plan presentations where data-driven insights require visual representation.
-
Slide Structure
2-slide set with four independent closed-form sections (rectangular boxes) arranged in parallel on each slide. Each section features an icon, title, and subtitle at the top, followed by 3-4 lines of descriptive text at the bottom. First slide emphasizes beige header; second slide emphasizes dark brown background for layout variation.
Related Products
-

Health Checkup Data Analysis Circular Graph – Effective Business Data Visualization
#Product/Service Introduction #Market and Competitor Analysis #Diagram
-

Space Industry Analysis Circular Graph
#Product/Service Introduction #Market and Competitor Analysis #Diagram
-

Visualizing Genetic Research Data with a Donut Chart
#Product/Service Introduction #Market and Competitor Analysis #Diagram
-

Medical System Configuration Graph – Infographic for Market Analysis
#Product/Service Introduction #Market and Competitor Analysis #Diagram
