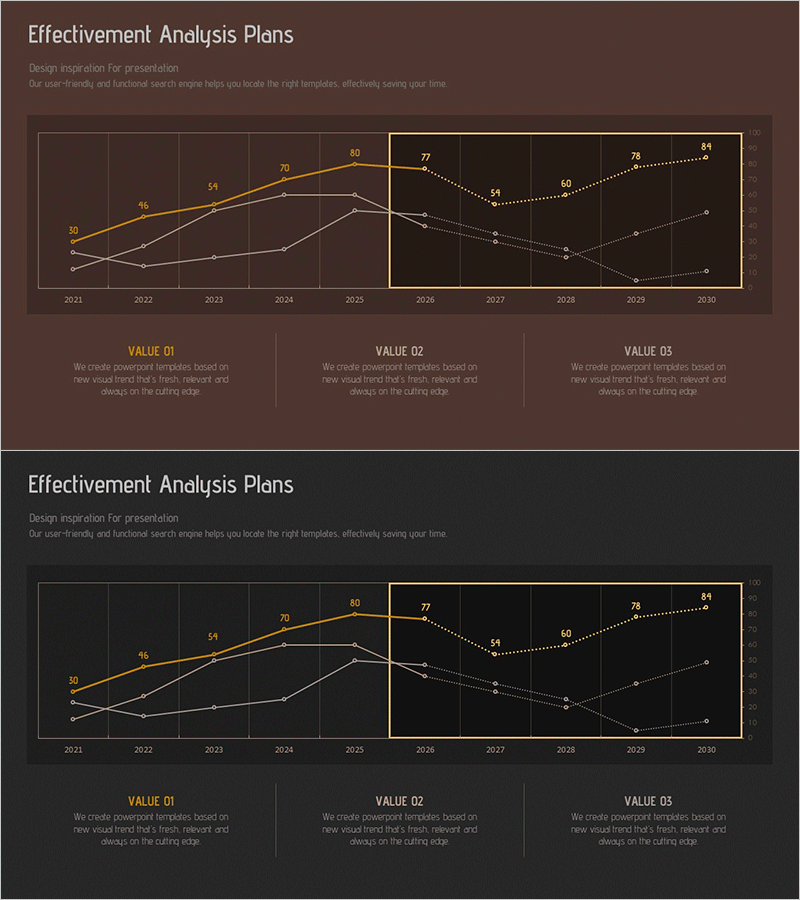
Marketing Service Effectiveness Analysis Chart – Visualizing Competitive Advantage
RM0400013_32
- Last Update 02/18/2025
- File Size 0.7MB
- # of Slides 2
- File Format PPTX
- Slide Ratio 16:9
- Color
Keywords
About the Product
This slide features a chart designed for visually analyzing the effectiveness of marketing services. It's crafted to showcase yearly performance using a blend of brown and yellow for clear comparison and analysis. Especially suitable for business reports or proposals focused on competitor analysis and market performance. Text and graph replacements are easy, with an overall editing difficulty rated as 'easy', making it user-friendly.
Usage Points
-
Main Usage
- This template is particularly useful for delivering insights during quarterly business reviews, where stakeholders can visually assess marketing performance across different time periods.
-
How to Use
- Presenters can utilize this slide during strategy meetings to effectively communicate the success of marketing initiatives, ensuring that team members grasp the impact of their efforts on overall business goals.
-
Recommended For
- This resource is ideal for marketing teams, business analysts, and project managers who need to convey data-driven results to executives or clients in a clear and engaging manner.
-
Slide Structure
- The structure is designed to facilitate a logical flow of information, starting with an introductory overview, followed by detailed performance metrics, and concluding with actionable recommendations based on the findings.
Related Products
-

Service Analysis Line Graph – Visualization of Competitive Advantage
#Market and Competitor Analysis #Diagram #Graph
-

Competitor Comparison Line Graph
#Market and Competitor Analysis #Graph #Competitor Analysis
-

Doughnut Chart Presentation for Pet Store Competitor Analysis
#Market and Competitor Analysis #Graph #Competitor Analysis
-

Market Competition: Deep Dive into Top 3 Firms
#Market and Competitor Analysis #Graph #Competitor Analysis
