Internet Shopping Market Comparative Analysis Graph
RJ0400046_19
- Last Update 05/29/2025
- File Size 0.5MB
- # of Slides 2
- File Format PPTX
- Slide Ratio 16:9
- Color
Keywords
- #Content-Based Slides
- #Design-Based Slides
- #Market and Competitor Analysis
- #Graph
- #Competitor Analysis
- #Competitive Advantage
- #Line
- #Line Chart
- #16:9
- #line chart PowerPoint
- #trend analysis slide template
- #market comparison chart
- #dual-series line graph
- #data visualization PPT
- #competitive analysis slide
About the Product
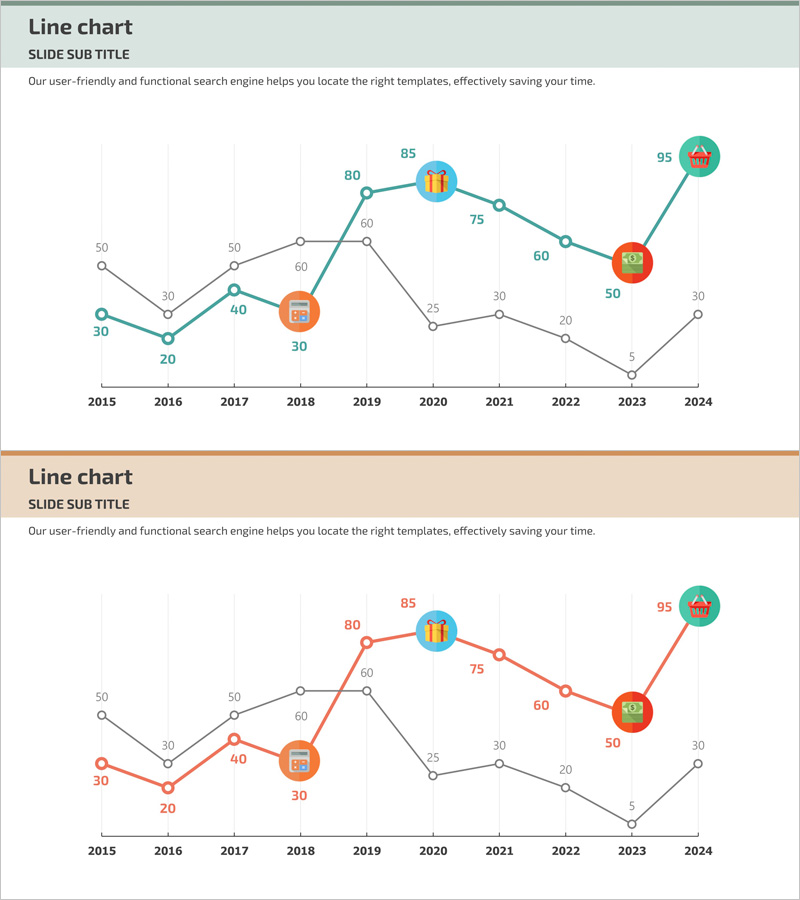
A dual-series line chart PowerPoint slide visualizing internet shopping market trends from 2015 to 2024. Each data point is labeled with numerical values and color-coded circular icons to highlight key inflection points and peak values. Teal and orange color schemes clearly distinguish the two data series, while a grid background facilitates accurate value reading. The 2-slide set offers multiple color variations optimized for 16:9 widescreen format. Instantly applicable for market analysis presentations, competitive benchmarking, and performance trend reports.
Usage Points
-
Main Usage
Simultaneously compare two market trends over time with clear visual distinction. Numerical labels and color-coded icons at each data point enable instant identification of peak values and turning points, while contrasting teal and orange series ensure easy differentiation.
-
How to Use
Use in business reports, market analysis presentations, competitive benchmarking, and annual performance reviews. Edit the slide values and labels with your own data for immediate deployment. Choose from two color scheme variations to match your presentation theme.
-
Recommended For
Marketing managers, business strategists, financial analysts, and consultants presenting market dynamics, revenue trends, customer growth, and competitor performance comparisons. Particularly suited for e-commerce, retail, and internet shopping industry analysis.
-
Slide Structure
2-slide set. Each slide displays a dual-series line chart with 10 data points (2015–2024). Features X-axis year labels, Y-axis numerical scale, grid background, and color-coded circular badges with numerical labels at each point. First slide uses teal and orange; second slide uses orange and gray color variations.
Related Products
-

Competitor Comparison Analysis Graph - Highlighting Competitive Advantage
#Market and Competitor Analysis #Graph #Competitor Analysis
-

Market Competitiveness Comparison Graph – Highlighting Competitive Advantage
#Market and Competitor Analysis #Graph #Competitor Analysis
-

Simple Cement Theme Broken Line Graph – Market and Competitor Analysis
#Market and Competitor Analysis #Graph #Competitor Analysis
-

Competitor Product Competitive Advantage Analysis Graph – Market Trends Visualization
#Market and Competitor Analysis #Graph #Competitor Analysis
