Gradient Vertical Bar Chart – Suitable for Market and Competitive Analysis
RJ0600103_20
- Last Update 07/18/2025
- File Size 0.6MB
- # of Slides 2
- File Format PPTX
- Slide Ratio 16:9
- Color
Keywords
- #Content-Based Slides
- #Design-Based Slides
- #Market and Competitor Analysis
- #Graph
- #Competitor Analysis
- #Competitive Advantage
- #Column
- #Column Chart
- #16:9
- #vertical bar chart PowerPoint
- #bar graph presentation slide
- #market analysis chart
- #competitive analysis template
- #data comparison PPT
- #gradient chart slide
About the Product
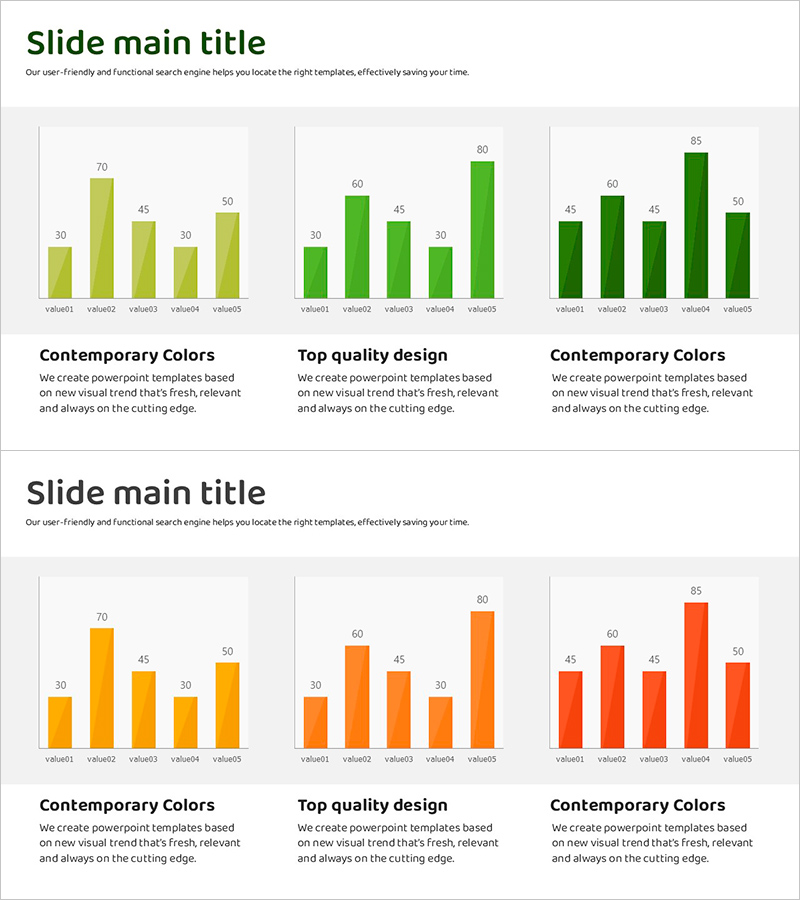
A vertical bar chart PowerPoint slide optimized for market analysis and competitive comparison. This presentation template features five-item bar graphs with gradient effects in lime, green, and orange tones, enabling intuitive visualization of relative data magnitudes. The 2-slide set provides the same layout with multiple color combinations, maintaining consistency while allowing visual variation across presentation sections. Delivered in editable PPTX format, it's ideal for marketing reports, sales presentations, and strategic analyses where you need to compare market share, competitive positioning, revenue performance, or regional metrics.
Usage Points
-
Main Usage
The primary goal is to clearly display relative magnitude comparisons of quantitative data. It effectively presents market size, competitor revenue, product sales volume, regional performance, or any dataset with 5+ items by using bar height as the visual metric. Gradient coloring helps distinguish data priorities or categories at a glance.
-
How to Use
Use this template in executive briefings, marketing strategy presentations, sales performance reviews, and market research reports. Simply replace the chart values and labels with your own data, and adjust colors to match your corporate branding if needed. The 2-slide format is useful for showing the same metric in different color schemes or comparing data across time periods.
-
Recommended For
Ideal for C-suite executives presenting quarterly or annual results, marketing teams analyzing market trends and competitive strategies, sales teams reviewing regional or product performance, consulting firms pitching client strategies, and academic or research institutions comparing datasets.
-
Slide Structure
Each slide contains a title area and a vertical bar chart section. The chart consists of 5 bars (value01 through value05) with numerical labels displayed above each bar. Gradient effects in lime, green, and orange tones are applied to the bars, with a legend positioned at the bottom (Contemporary Colors, Top quality design, etc.). Both slides maintain identical structure with different color palettes.
Related Products
-

3 Competitive Advantage Graphs – Market and Competitor Analysis
#Market and Competitor Analysis #Graph #Competitor Analysis
-

Travel Guide Industry Competitor Analysis Vertical Bar Chart
#Market and Competitor Analysis #Graph #Competitor Analysis
-

Competitor Analysis Bar Graph - Visualizing Market Status
#Market and Competitor Analysis #Graph #Competitor Analysis
-

Competitor Comparison Analysis Bar Graph
#Market and Competitor Analysis #Graph #Competitor Analysis
