Market Trend Analysis Graph & Table Chart
RM0400002_6
- Last Update 02/14/2025
- File Size 1MB
- # of Slides 2
- File Format PPTX
- Slide Ratio 16:9
- Color
Keywords
- #Content-Based Slides
- #Design-Based Slides
- #Market and Competitor Analysis
- #Diagram
- #Graph
- #Competitor Analysis
- #Industry Trends
- #Table
- #Line
- #Standard Table
- #Line Chart
- #16:9
- #line chart PowerPoint
- #market trend analysis slide
- #dual-series chart template
- #data visualization PowerPoint
- #competitive analysis graph
About the Product
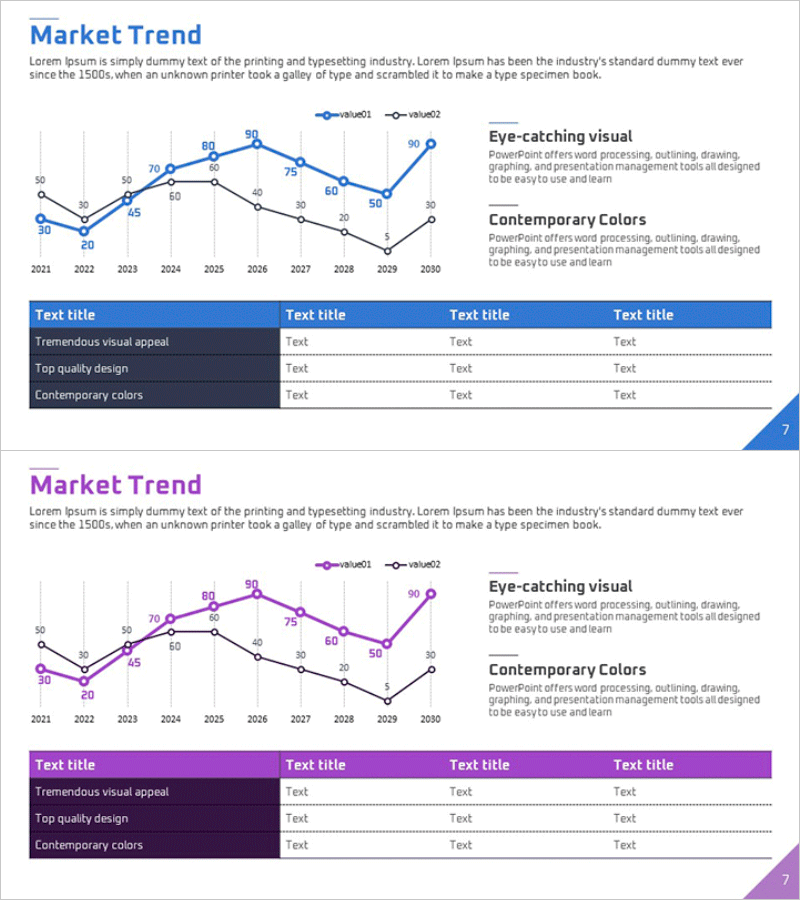
A PowerPoint slide template featuring a dual-series line chart comparing market trends from 2021 to 2030. Blue and black data lines with numeric labels clearly visualize change trajectories and performance variations. The right side includes three text boxes highlighting key messages: 'Eye-catching visual', 'Top quality design', and 'Contemporary colors'. A summary table at the bottom organizes detailed information across four columns. This presentation slide is ready to use for business reports, market analysis documents, competitive benchmarking, and executive presentations.
Usage Points
-
Main Usage
Compare two or more data series over time, such as market trends, sales performance, or competitor metrics. The line chart enables quick visual identification of upward, downward, and fluctuating patterns to support data-driven decision-making.
-
How to Use
Input actual data into the line chart at the top of the slide, add analysis insights and conclusions in the right-side text boxes, and summarize key metrics in the bottom table. Colors and layout are fully editable to match your corporate branding.
-
Recommended For
Executive reports, quarterly performance reviews, market research presentations, investor relations meetings, and marketing strategy sessions. Ideal for business analysts, marketing managers, financial officers, and executives who need to present data-driven insights.
-
Slide Structure
Top: dual-series line chart with 10 data points (2021–2030), right: three text boxes for title and key messages, bottom: 4-column × 3-row summary table. 16:9 aspect ratio, 2-slide set.
Related Products
-

Market Trend Analysis Broken Line Graph – Competitor Analysis
#Market and Competitor Analysis #Diagram #Graph
-

Market Trend Analysis Graph & Table Chart – Insightful Data Visualization
#Market and Competitor Analysis #Diagram #Graph
-

Comparison Graph of Yearly Trends – Market and Competitor Analysis
#Market and Competitor Analysis #Diagram #Graph
-

Sales and Profit Analysis Graph – Market Trends and Forecast
#Market and Competitor Analysis #Diagram #Graph
