Table of Brand Sales Performance by Year – Financial Planning and Results
RM0400012_28
- Last Update 02/18/2025
- File Size 1MB
- # of Slides 2
- File Format PPTX
- Slide Ratio 16:9
- Color
Keywords
- #Content-Based Slides
- #Design-Based Slides
- #Financial Plans and Performance
- #Diagram
- #Capital Requirements
- #Cash Flow Statement
- #Table
- #16:9
- #sales performance table PowerPoint
- #year-over-year comparison slide
- #financial data table PPT
- #brand sales report PowerPoint
- #multi-year comparison table template
About the Product
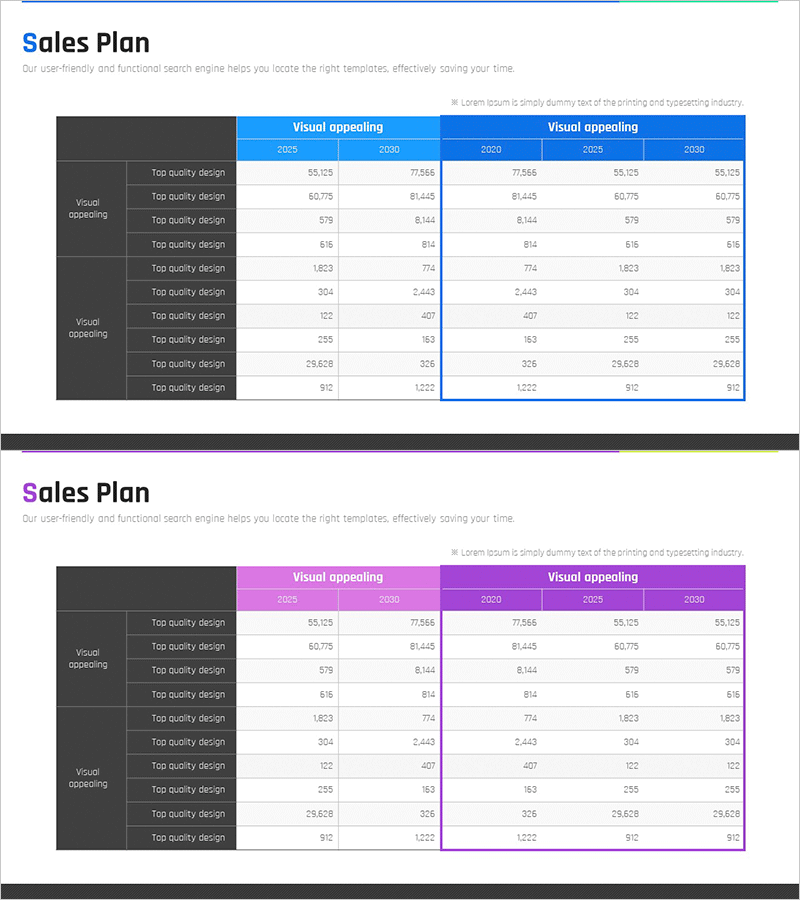
A PowerPoint slide designed to compare brand sales performance across multiple years. The layout features a left-side category area and a right-side data table, with two color versions available: blue and pink. Both versions maintain identical structure with only the header color varying to match your presentation style. The slide accommodates multi-year data (2025, 2030, 2020, etc.) in a side-by-side comparison format, making it ideal for financial planning and performance reporting. The table structure supports quick data-driven decision-making and is ready to use in presentations, reports, and business proposals.
Usage Points
-
Main Usage
This slide presents brand or product sales performance across multiple years in a data-driven format. The left category area organizes line items while the right table displays year-over-year figures, enabling clear comparison and supporting evidence-based decision-making in financial communications.
-
How to Use
Insert this slide into business reports, financial planning presentations, investor relations materials, quarterly or annual performance reviews, and sales analysis decks. Simply replace the category labels on the left and numerical values in the table with your actual data. Choose the blue version for formal, trustworthy presentations or the pink version for brand-identity-focused communications.
-
Recommended For
Finance teams, executives, and marketing professionals presenting sales results and financial performance. Particularly useful for multi-year trend analysis, brand-by-brand performance comparison, investor presentations, executive briefings, and internal management meetings requiring data-backed communication.
-
Slide Structure
The slide is divided into two sections: a left dark-gray category area (10 rows of category labels) and a right data table (5 year columns plus 10 data rows). Each row contains a category name and corresponding numerical values for years 2025, 2030, 2020, 2025, and 2030. All table cells are fully editable text fields.
Related Products
-

Financial Plan Blue Green – Effective Fund Management
#Financial Plans and Performance #Diagram #Capital Requirements
-

Financial Plan Slide – Harmony of Teal and Yellow
#Financial Plans and Performance #Diagram #Capital Requirements
-

Project Finance Management Plan – Effective Financial Planning
#Financial Plans and Performance #Diagram #Capital Requirements
-

Sleek Visual Presentation Template – Impactful Data Presentation
#Financial Plans and Performance #Diagram #Capital Requirements
