Tax Invoice for Interior Work PowerPoint Slide – Financial Planning and Outcomes
RJ0900027_25
- Last Update 08/24/2025
- File Size 0.7MB
- # of Slides 2
- File Format PPTX
- Slide Ratio 16:9
- Color
Keywords
- #Content-Based Slides
- #Design-Based Slides
- #Financial Plans and Performance
- #Diagram
- #Capital Requirements
- #Cash Flow Statement
- #Table
- #16:9
- #data comparison table PowerPoint
- #4-column table slide design
- #financial data table template
- #comparative analysis slide
- #how to create a data table in PowerPoint
About the Product
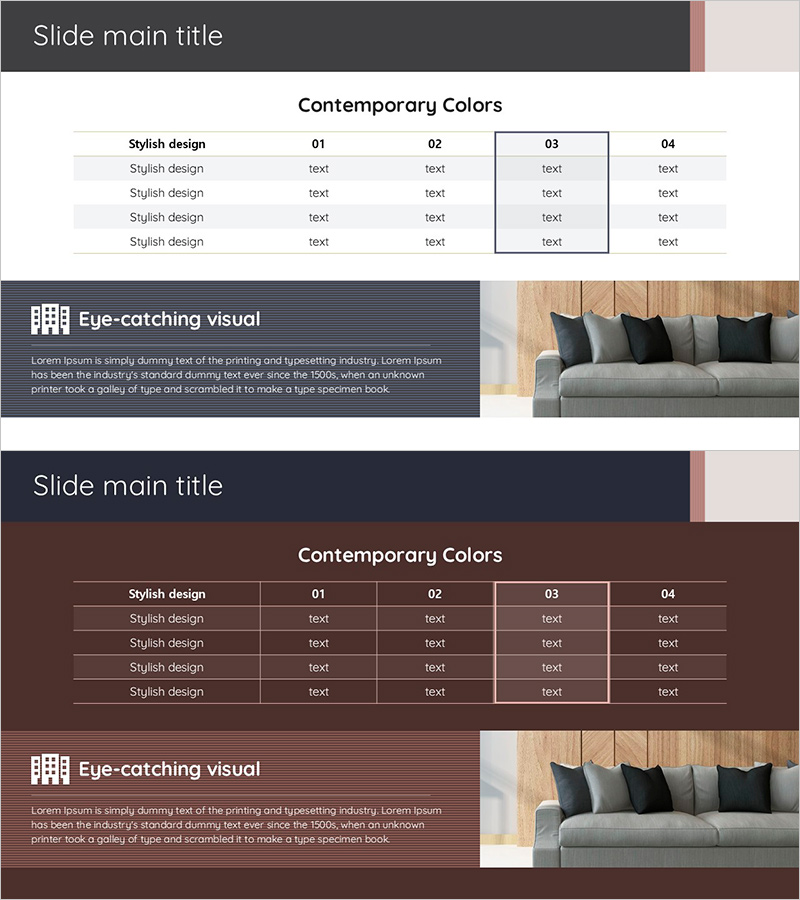
A professional data comparison table PowerPoint slide featuring contemporary gray and brown dual-tone color scheme. The 4-column structure provides clear information hierarchy, allowing you to input text and numerical data in each cell. Perfect for visualizing financial data, comparative analysis, and performance metrics. The right-side image area accommodates product photos, case studies, or environmental imagery to enhance presentation impact. This 2-slide set includes both light and dark color variations, enabling you to match your document's overall tone and maintain visual consistency throughout your presentation.
Usage Points
-
Main Usage
This slide effectively communicates financial data, performance indicators, and comparative analysis in tabular format. The 4-column structure enables simultaneous comparison of metrics, percentages, and outcomes across categories, emphasizing transparency and credibility in corporate presentations.
-
How to Use
Enter item names, figures, percentages, and descriptions into each table cell. Place product photos, case study images, or environmental visuals in the right-side image area. Select either the light or dark color version to match your overall document aesthetic and ensure visual consistency.
-
Recommended For
Finance teams, executives, consultants, and marketing professionals presenting quarterly results, budget status, market comparisons, and customer satisfaction metrics. Ideal for investor presentations, board reports, strategy meetings, and proposal documents requiring data credibility.
-
Slide Structure
The layout comprises a title area at the top, a central 4-column table (1 header row + 4 data rows), and a right-side image area. The table features 5 rows and 4 columns with independently editable cells, while the image area allows flexible resizing for various visual content.
Related Products
-

Financial Plan Slide – Harmony of Teal and Yellow
#Financial Plans and Performance #Diagram #Capital Requirements
-

Financial Plan Blue Green – Effective Fund Management
#Financial Plans and Performance #Diagram #Capital Requirements
-

Table of Brand Sales Performance by Year – Financial Planning and Results
#Financial Plans and Performance #Diagram #Capital Requirements
-

Sleek Visual Presentation Template – Impactful Data Presentation
#Financial Plans and Performance #Diagram #Capital Requirements
