Financial Plan Blue Green – Effective Fund Management
RJ0600005_15
- Last Update 06/22/2025
- File Size 2.6MB
- # of Slides 2
- File Format PPTX
- Slide Ratio 16:9
- Color
Keywords
- #Content-Based Slides
- #Design-Based Slides
- #Financial Plans and Performance
- #Diagram
- #Capital Requirements
- #Cash Flow Statement
- #Table
- #16:9
- #financial plan table PowerPoint slide
- #financial data PPT template
- #cash flow statement slide
- #financial metrics comparison
- #capital requirements presentation
About the Product
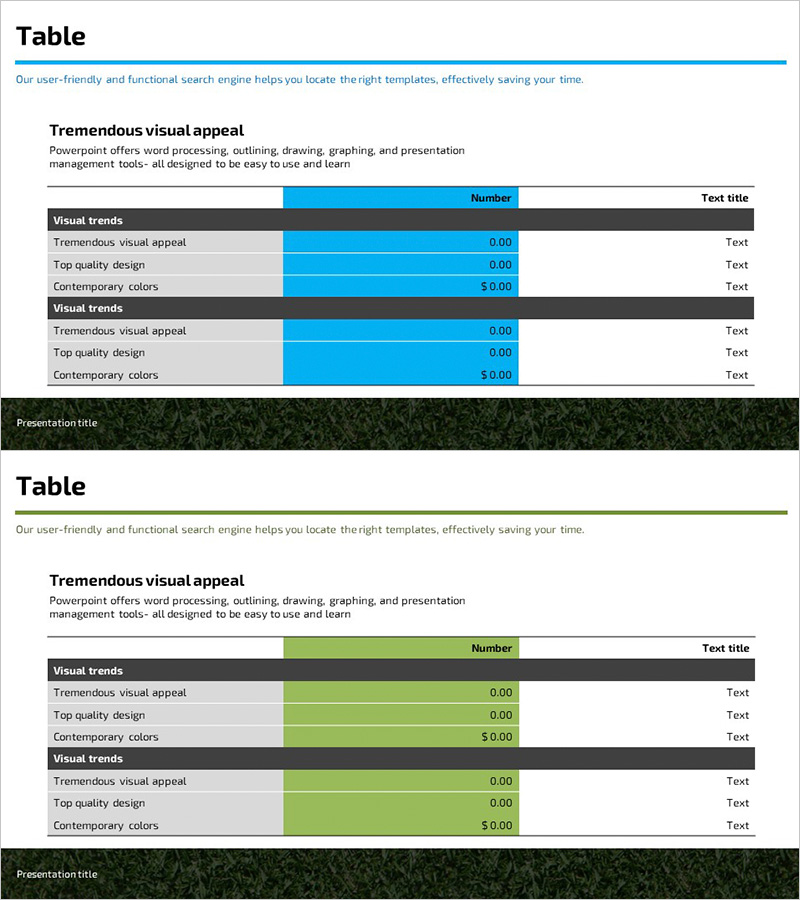
A 2-slide PowerPoint presentation designed to visualize financial data with clarity and impact. The dual-tone blue and green color scheme separates comparison elements, making capital requirements, cash flow, and financial metrics instantly recognizable. Each slide features dedicated data entry cells and descriptive text areas, ready for immediate use in financial reports, business plans, and investor presentations. Delivered in 16:9 widescreen PPTX format for universal compatibility across all presentation platforms.
Usage Points
-
Main Usage
Present financial data and numerical information in a structured table format that builds credibility with investors, executives, and stakeholders. The blue-green color differentiation enables intuitive comparative analysis and scenario planning.
-
How to Use
Insert into the financial section of business plans, financial overview pages of investor decks, or fund management portions of executive reports. Populate cells with actual figures, add legends or footnotes as needed, and customize to match your presentation narrative.
-
Recommended For
Ideal for CFOs, finance managers, executives, and investor-facing presentations. Particularly valuable for startup pitch decks, quarterly financial reviews, management reports, and consulting firm financial analysis materials.
-
Slide Structure
Two-slide deck with header areas for titles and legends, followed by multi-row, multi-column data tables. Blue and green accent zones enable side-by-side comparison of financial scenarios, time periods, or budget categories within a single cohesive layout.
Related Products
-

Project Finance Management Plan – Effective Financial Planning
#Financial Plans and Performance #Diagram #Capital Requirements
-

Table of Brand Sales Performance by Year – Financial Planning and Results
#Financial Plans and Performance #Diagram #Capital Requirements
-

Financial Plan Slide – Harmony of Teal and Yellow
#Financial Plans and Performance #Diagram #Capital Requirements
-

Yellow Highlight Standard Table – Financial Performance Visualization
#Financial Plans and Performance #Diagram #Capital Requirements
