Yellow Highlight Standard Table – Financial Performance Visualization
RB0800011_11
- Last Update 03/19/2025
- File Size 7.5MB
- # of Slides 2
- File Format PPTX
- Slide Ratio 4:3
- Color
Keywords
- #Content-Based Slides
- #Design-Based Slides
- #Financial Plans and Performance
- #Diagram
- #Capital Requirements
- #Cash Flow Statement
- #Table
- #Standard Table
- #4:3
- #data table PowerPoint slide
- #financial table template
- #4-column table design
- #yellow highlight table
- #table slide download
- #spreadsheet PowerPoint template
About the Product
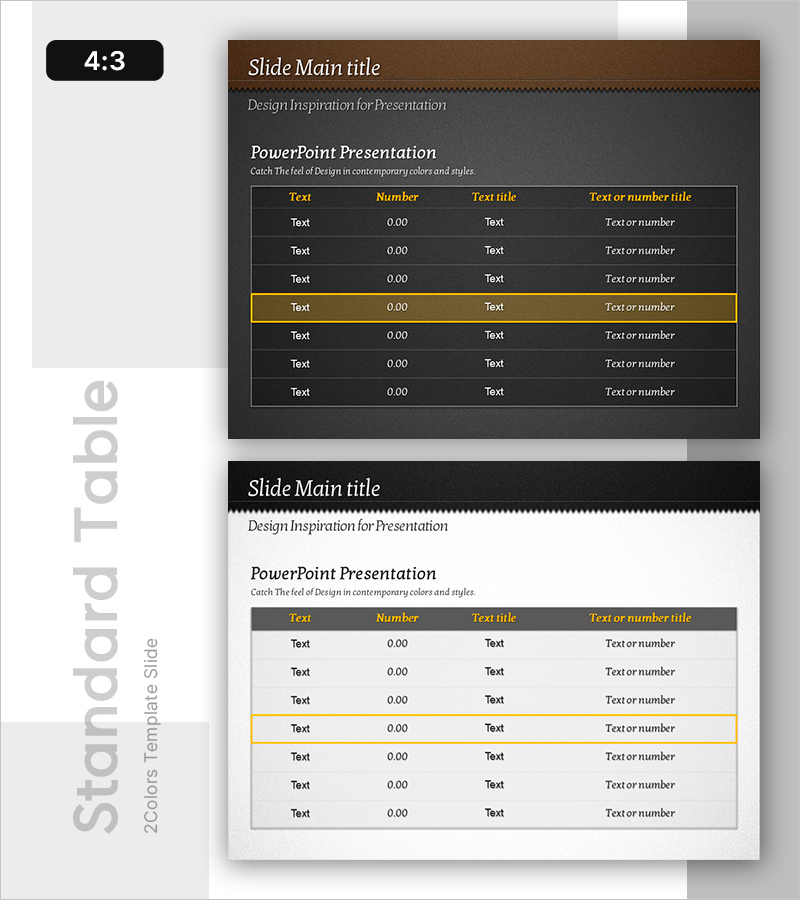
A professional data table PowerPoint slide optimized for financial performance, budget planning, and cash flow analysis. Features a 4-column structure (text, number, title, description) with 7 data rows, including one yellow highlight row to emphasize key metrics. Dark gray background with white typography and yellow accent lines creates strong visual contrast. Includes 2 slides in 4:3 aspect ratio, fully editable and ready to use in financial reports, business plans, and performance presentations. Simply input your data into the table template to create a polished, professional visualization.
Usage Points
-
Main Usage
Organize and compare numerical data such as financial performance, budget allocations, cash flow statements, sales figures, and cost analysis. The yellow highlight row draws immediate attention to target values, key performance indicators, and cumulative totals.
-
How to Use
Insert into business plans, financial reports, quarterly performance presentations, and investment pitch decks where data-driven information is critical. Replace placeholder text and numbers with your actual data; the yellow highlight row automatically emphasizes key figures. Compatible with all projectors and displays in 4:3 format.
-
Recommended For
Finance teams, executives, business planners, consultants, and educators. Ideal for meetings, presentations, and reports requiring numerical analysis and decision-making. Particularly effective for budget planning, performance evaluation, and investment review materials.
-
Slide Structure
2-slide set. Slide 1: Dark gray background with title area and 4-column × 7-row table with one yellow highlight row. Slide 2: Light background version. All cells are fully editable; rows and columns can be easily added or removed as needed.
Related Products
-

Sleek Visual Presentation Template – Impactful Data Presentation
#Financial Plans and Performance #Diagram #Capital Requirements
-

Financial Plan Slide – Harmony of Teal and Yellow
#Financial Plans and Performance #Diagram #Capital Requirements
-

Fund Planning and Revenue Tables – Financial Performance Analysis
#Financial Plans and Performance #Diagram #Other
-

Diagram Slide for Funding Plans and Sales Statements
#Financial Plans and Performance #Diagram #Capital Requirements
