Project Finance Management Plan – Effective Financial Planning
RM0500007_28
- Last Update 02/22/2025
- File Size 3.1MB
- # of Slides 2
- File Format PPTX
- Slide Ratio 16:9
- Color
Keywords
About the Product
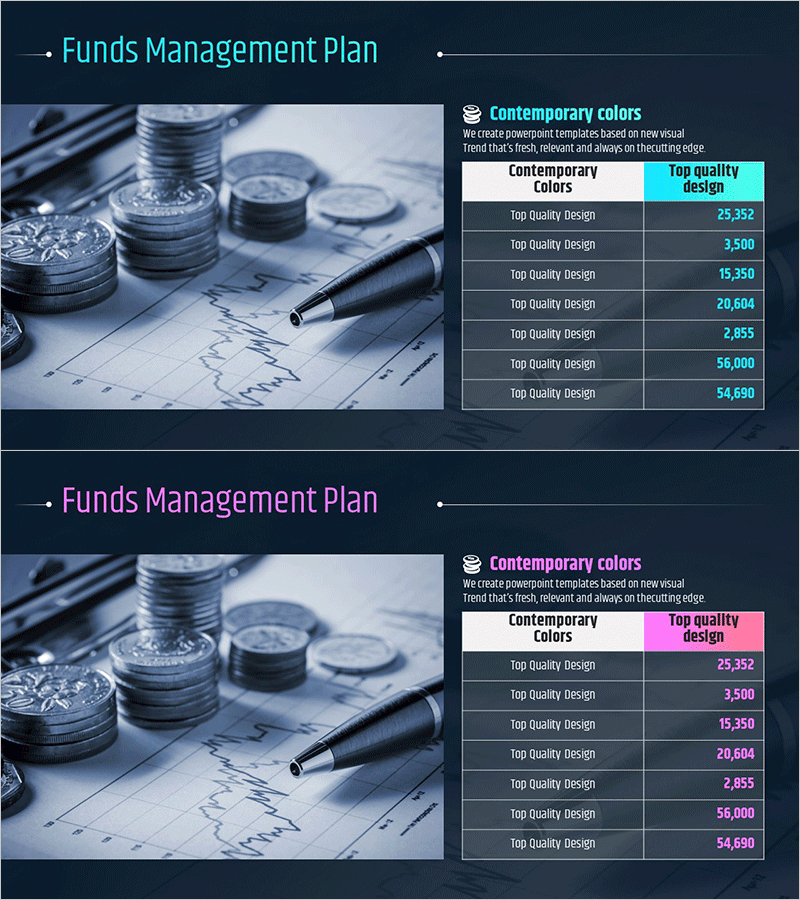
A financial data table slide designed for project funds management and cash flow planning. Featuring a dark navy background with cyan accent colors across 2 slides, this PowerPoint combines a left image area with a right-aligned data table layout for intuitive financial information delivery. Visualizes required funds, return on investment, and financial metrics with clear numerical presentation. The slide set is ready for immediate use in presentations and financial reports, provided in 16:9 widescreen PPTX format with editable text and data entry fields.
Usage Points
-
Main Usage
Communicates project funds management and financial status through data-driven visualization. Used by investors, executives, and finance teams to report required funds, return on investment, and financial indicators. Optimized for explaining cash flow planning and budget allocation visually and numerically.
-
How to Use
Insert relevant financial imagery (coins, graphs, pen) in the left image area and input actual financial figures in the right data table. Maintain the cyan header color while adding or modifying data rows. Adjust font sizes and numerical formats to match your presentation context and audience requirements.
-
Recommended For
Ideal for CFOs, finance managers, project managers, and investment officers presenting funds planning, investor relations materials, financial reports, and business proposals. Particularly effective for required funds planning, ROI analysis, and budget status reporting sections requiring credible data visualization.
-
Slide Structure
2-slide layout with each slide divided into left image area (approximately 40%) and right data table area (approximately 60%). Table comprises header row (Contemporary Colors·Top quality design) plus 7 data rows. Cyan accent header and dark navy background enhance numerical readability and visual hierarchy.
Related Products
-

Sleek Visual Presentation Template – Impactful Data Presentation
#Financial Plans and Performance #Diagram #Capital Requirements
-

Tax Invoice for Interior Work PowerPoint Slide – Financial Planning and Outcomes
#Financial Plans and Performance #Diagram #Capital Requirements
-

Table of Brand Sales Performance by Year – Financial Planning and Results
#Financial Plans and Performance #Diagram #Capital Requirements
-

Financial Plan Slide – Harmony of Teal and Yellow
#Financial Plans and Performance #Diagram #Capital Requirements
