Consumer Analysis Chart by Age Group – Market Share and Customer Analysis
RM0400012_11
- Last Update 02/18/2025
- File Size 1MB
- # of Slides 2
- File Format PPTX
- Slide Ratio 16:9
- Color
Keywords
About the Product
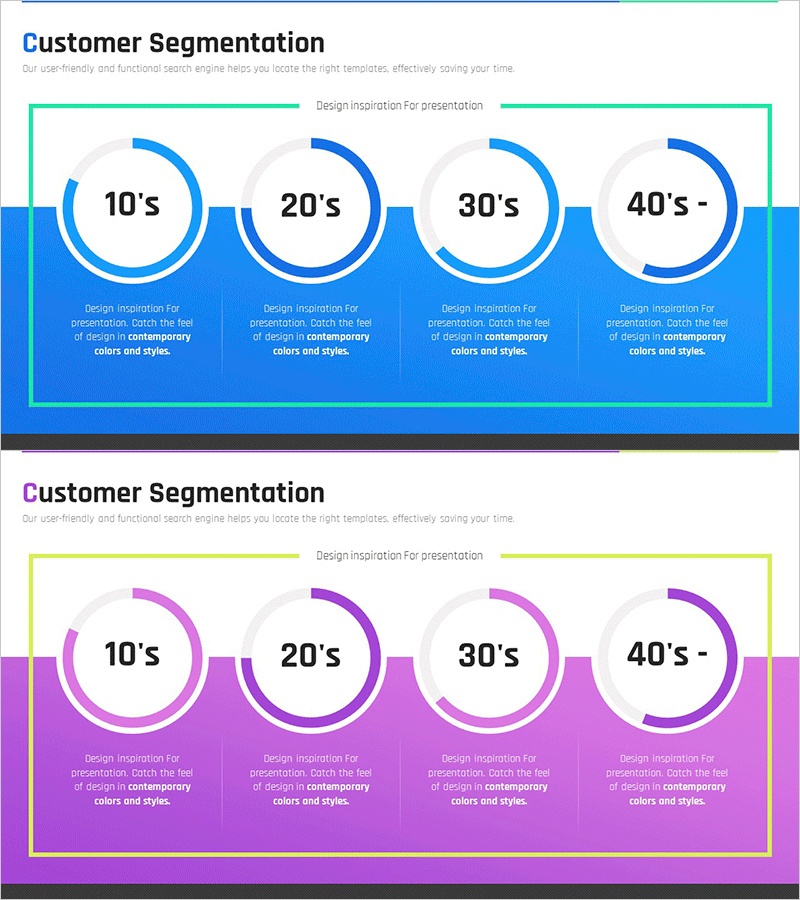
A donut chart PowerPoint slide designed for analyzing consumer segments by age group. This presentation template visualizes market share across four age demographics—10s, 20s, 30s, and 40s and above—using a circular donut chart format. The design features two color variations: blue and purple versions, with each segment clearly distinguished by color. The donut structure with a hollow center emphasizes data proportions intuitively. Perfect for business presentations including customer analysis reports, market analysis, sales performance reviews, and demographic breakdowns.
Usage Points
-
Main Usage
Visualize age-based market share, customer composition ratios, and sales performance using a donut chart format to clearly communicate data comparisons and demographic breakdowns.
-
How to Use
Deploy in marketing strategy presentations, market analysis reports, customer segmentation presentations, and sales performance briefings to compare age-group proportions at a glance.
-
Recommended For
Marketing teams, sales departments, executives, market research analysts, and business intelligence professionals presenting customer demographic data and market segmentation insights.
-
Slide Structure
Four age-group segments (10s, 20s, 30s, 40s+) represented as a donut chart with distinct color coding for each section. Includes two slide layouts: blue version and purple version for design flexibility.
Related Products
-

Key Customer Segmentation Analysis Donut Chart
#Market and Competitor Analysis #Graph #Customer Analysis
-

User Gender Ratio Analysis Graph – Visualizing Market Share
#Market and Competitor Analysis #Graph #Customer Analysis
-

Customer Analysis Donut Chart - Visualizing Market Share
#Market and Competitor Analysis #Graph #Other
-

Children's Competency Analysis Chart – Competitive Market Analysis
#Market and Competitor Analysis #Graph #Customer Analysis
