Key Customer Segmentation Analysis Donut Chart
RM0400014_11
- Last Update 02/18/2025
- File Size 1.1MB
- # of Slides 2
- File Format PPTX
- Slide Ratio 16:9
- Color
Keywords
About the Product
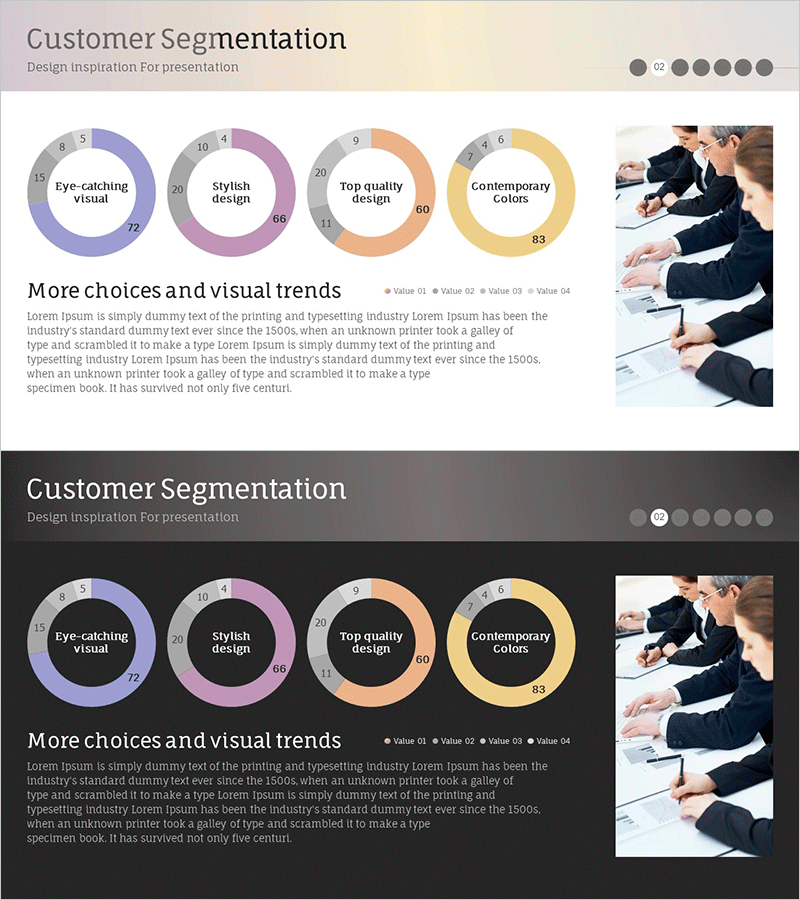
A professional donut chart PowerPoint slide designed for customer segmentation analysis and market share visualization. Features four distinct segments displayed in a soft color palette of lavender, pink, coral, and yellow tones. Each segment clearly shows numerical values and percentages for easy data interpretation. Two design versions are included: a light beige background for print presentations and a dark background for screen displays. Ideal for business reports, marketing strategy presentations, and competitive analysis slides.
Usage Points
-
Main Usage
Visualize customer segmentation data, market share distribution, and comparative analysis across customer groups. The donut chart format effectively communicates proportional relationships and segment sizes, making it essential for data-driven business presentations, financial reports, and strategic planning documents.
-
How to Use
Replace the sample data with your actual customer segmentation figures. Edit segment labels to match your customer categories (New Customers, Existing Customers, VIP, Prospects, etc.) and update the percentage values accordingly. Select the light background version for printed materials and the dark version for digital presentations. All elements are fully editable in PowerPoint.
-
Recommended For
Marketing teams presenting customer analysis, sales strategy meetings, executive business reports, and strategic planning sessions. Particularly effective for explaining customer composition, market penetration, revenue distribution by segment, and competitive positioning in board presentations.
-
Slide Structure
Two-slide layout. Slide 1 features a light beige background with four donut charts labeled 'Eye-catching visual,' 'Stylish design,' 'Top quality design,' and 'Contemporary Colors,' accompanied by a business team photo on the right. Slide 2 presents the same four donut charts on a dark background. Each chart includes a center text area and outer numerical indicators for data clarity.
Related Products
-

Customer Analysis Donut Chart - Visualizing Market Share
#Market and Competitor Analysis #Graph #Other
-

Spotlight on Customer Segments – Market Share Network
#Market and Competitor Analysis #Graph #Customer Analysis
-

Market Share Donut Pie Chart & Silhouette – Unique Design and Information Delivery
#Market and Competitor Analysis #Graph #Other
-

Children's Competency Analysis Chart – Competitive Market Analysis
#Market and Competitor Analysis #Graph #Customer Analysis
