Marketing Budget Allocation Chart – Visualizing Operations and Performance
RM0400011_28
- Last Update 02/17/2025
- File Size 0.5MB
- # of Slides 2
- File Format PPTX
- Slide Ratio 16:9
- Color
Keywords
- #Content-Based Slides
- #Design-Based Slides
- #Operational Plan
- #Financial Plans and Performance
- #Diagram
- #Capital Investment Plan
- #Capital Requirements
- #Table
- #16:9
- #quarterly sales plan PowerPoint
- #sales forecast slide template
- #financial data table PPT
- #quarterly comparison slide
- #how to create a sales plan in PowerPoint
About the Product
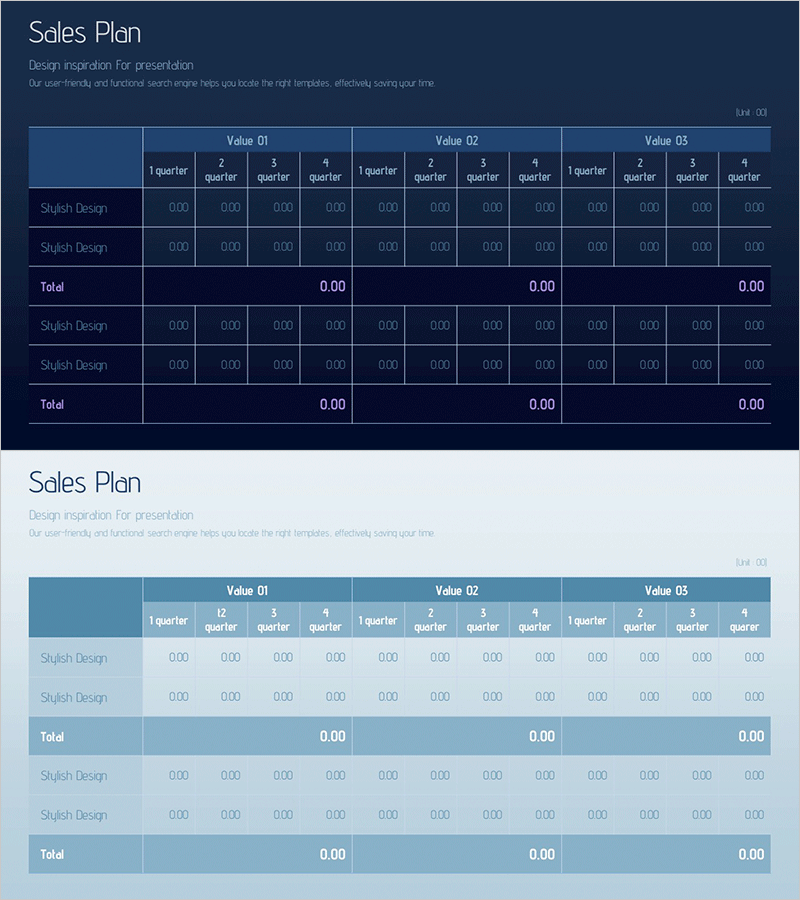
A PowerPoint slide designed to compare quarterly sales plans across three values (Value 01, 02, 03). This two-slide set features a dark blue background version and a light blue background version, each with a structured table layout for entering quarterly data. The table includes row items (Sketch Design) and subtotal rows (Total) for systematic financial data organization. The slide is fully editable in PowerPoint and suitable for marketing budget allocation, sales forecasting, operational performance comparison, and executive presentations.
Usage Points
-
Main Usage
This slide enables comparison and analysis of quarterly sales targets, budget allocation, and sales forecasts using numerical data. The ability to compare three independent values (product lines, regions, channels) simultaneously makes it effective for presenting decision-making evidence.
-
How to Use
Enter product names, region names, or channel names in the Sketch Design rows, then input corresponding quarterly figures in the four quarter columns. Set the Total row for automatic calculation to enable real-time sum tracking. Choose between dark blue or light blue background versions to match your presentation tone.
-
Recommended For
Ideal for finance and marketing teams presenting quarterly performance reports, budget allocation explanations to executives, and sales team goal achievement tracking. Particularly useful in investor relations materials, business plans, and quarterly reports requiring simultaneous comparison of multiple product lines, regions, or channels.
-
Slide Structure
Each slide contains a title area (Sales Plan), descriptive text, and a multi-value table. The table structure consists of 2 item rows (Sketch Design entries) plus 1 Total row, spanning 13 columns (4 quarters × 3 values plus subtotals), optimized for numerical input and comparative analysis.
Related Products
-

Sales Revenue Analysis Table – Operational Planning and Performance
#Operational Plan #Financial Plans and Performance #Diagram
-

Promotional Product Sales Revenue Structure Table
#Operational Plan #Financial Plans and Performance #Diagram
-

Construction Permit and Construction Status Table – Operational Plan and Financial Performance
#Operational Plan #Financial Plans and Performance #Diagram
-

Table of Operating Capital Securing Strategies – Financial Planning and Performance
#Operational Plan #Financial Plans and Performance #Diagram
