Promotional Product Sales Revenue Structure Table
RM0400013_28
- Last Update 02/18/2025
- File Size 0.6MB
- # of Slides 2
- File Format PPTX
- Slide Ratio 16:9
- Color
Keywords
- #Content-Based Slides
- #Design-Based Slides
- #Operational Plan
- #Financial Plans and Performance
- #Diagram
- #Capital Investment Plan
- #Capital Requirements
- #Table
- #16:9
- #sales revenue structure PPT slide
- #quarterly sales comparison table
- #financial data PowerPoint template
- #product revenue analysis slide
- #quarterly sales report template
About the Product
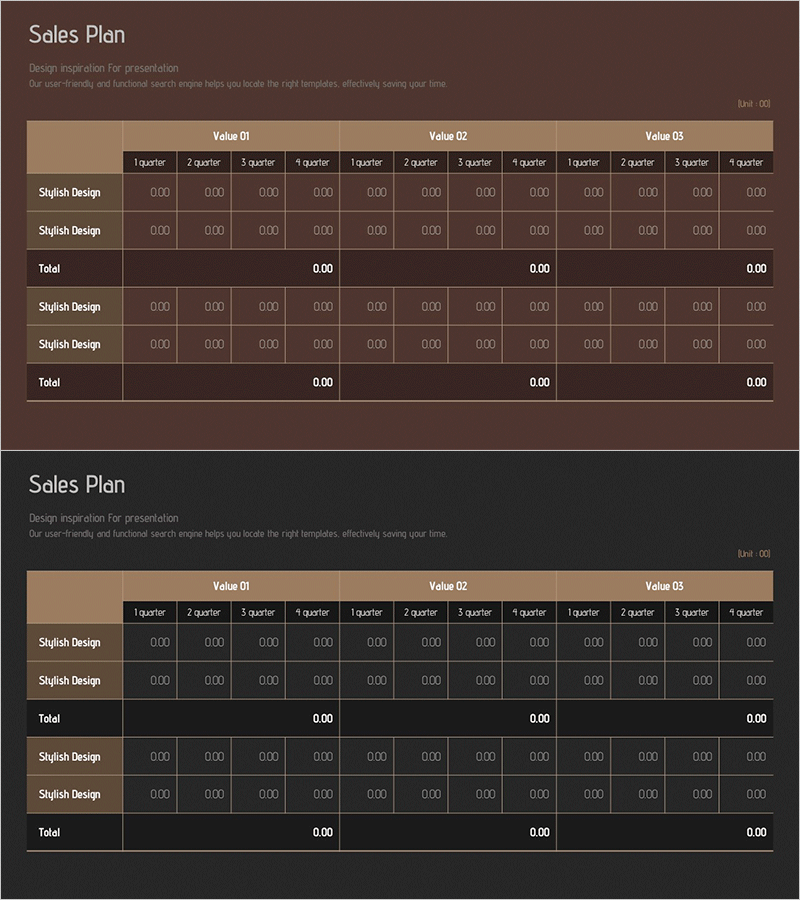
A PowerPoint slide designed to compare quarterly sales revenue structures across three promotional products. The template features a brown background with beige table headers on the first slide and a dark background version on the second. Each slide accommodates three products (Value 01, 02, 03) with quarterly data entry fields (Q1–Q4), including subtotal rows for each product and overall totals. The structured layout enhances readability of financial data and supports clear presentation of sales performance analysis, revenue trends, and product-level profitability comparisons in business reports and financial presentations.
Usage Points
-
Main Usage
This slide enables clear visual comparison of quarterly sales revenue across multiple products, presenting quantitative performance metrics to stakeholders. The structured table layout supports financial analysis and decision-making by organizing sales data in an easy-to-read format suitable for executive presentations, investor reports, and team performance reviews.
-
How to Use
Enter quarterly sales figures (in 0.0.0 format) for each product row, and totals calculate automatically. Choose between the brown or dark background version based on your presentation theme. Use this slide in quarterly sales reports, financial performance meetings, revenue analysis presentations, and business planning sessions.
-
Recommended For
Sales managers, finance professionals, and executives analyzing and reporting sales performance. Ideal for quarterly performance evaluations, product-level profitability comparisons, and data-driven financial planning. Applicable across organizations of all sizes—from startups to enterprises—for sales and financial reporting.
-
Slide Structure
Two-slide template with identical structure: each slide displays 3 products (Value 01, 02, 03) across 4 quarters (Q1–Q4). Layout includes 2 rows per product plus subtotal row (3 rows total), with 12 quarterly data cells and 3 subtotal cells per slide. Brown and dark background versions provided separately.
Related Products
-

Construction Permit and Construction Status Table – Operational Plan and Financial Performance
#Operational Plan #Financial Plans and Performance #Diagram
-

Marketing Budget Allocation Chart – Visualizing Operations and Performance
#Operational Plan #Financial Plans and Performance #Diagram
-

Sales Revenue Comparison Analysis Table – Effective Operational Planning
#Operational Plan #Financial Plans and Performance #Diagram
-

Sales Revenue Analysis Table – Operational Planning and Performance
#Operational Plan #Financial Plans and Performance #Diagram
