Sales Revenue Comparison Analysis Table – Effective Operational Planning
RM0400007_28
- Last Update 02/16/2025
- File Size 0.3MB
- # of Slides 2
- File Format PPTX
- Slide Ratio 16:9
- Color
Keywords
- #Content-Based Slides
- #Design-Based Slides
- #Operational Plan
- #Financial Plans and Performance
- #Diagram
- #Capital Investment Plan
- #Capital Requirements
- #Table
- #16:9
- #sales revenue comparison PowerPoint slide
- #financial analysis table template
- #sales performance data slide
- #revenue comparison PPT
- #how to create sales analysis in PowerPoint
About the Product
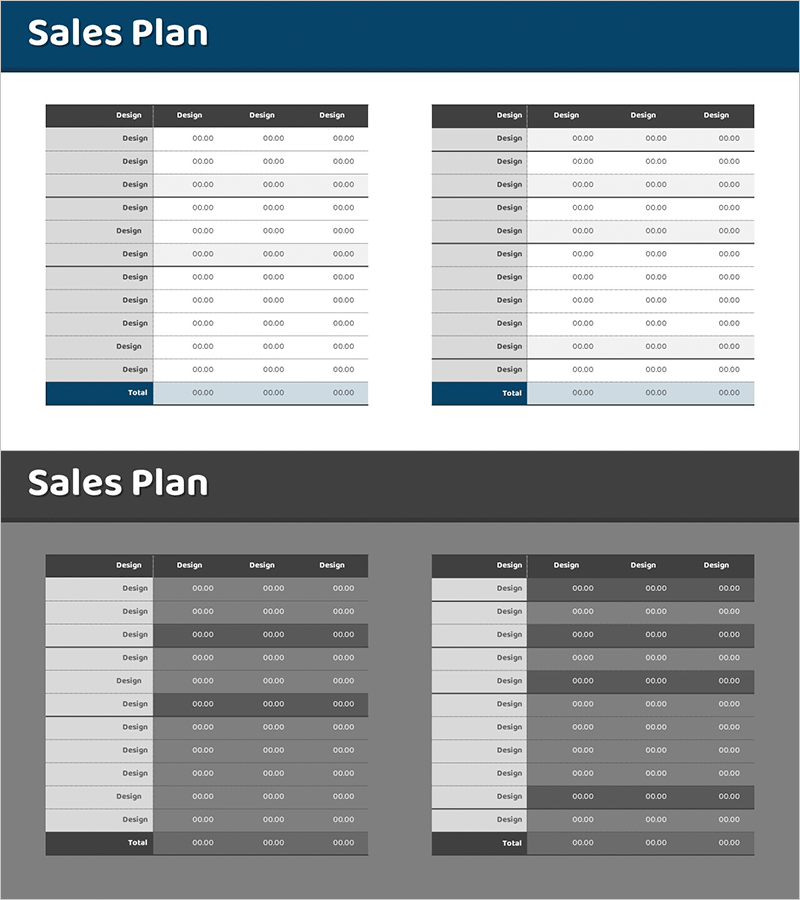
A PowerPoint slide designed for sales revenue comparison analysis featuring a dual-section parallel table structure. The layout combines dark headers with light gray rows to create clear data visualization for financial metrics. Each table includes four columns for numerical input, optimized for comparing quarterly, monthly, or departmental sales performance. This presentation slide effectively communicates financial results in business reports and operational planning documents.
Usage Points
-
Main Usage
Compare sales revenue data across departments, regions, or product lines while presenting quantitative financial performance. The dark header and light row contrast maximizes data readability, making financial information a reliable foundation for management decision-making.
-
How to Use
Enter sales revenue figures into the row labels and four columns of each table for comparative analysis. Use for quarterly or monthly performance reports, target versus actual analysis, regional sales updates, and financial presentations to management and stakeholders.
-
Recommended For
Finance teams, sales departments, and executives presenting sales performance reports. Ideal for quarterly and annual financial analysis presentations, investor relations materials, and operational planning sessions. Suitable for business plans, annual reports, and investor pitch decks.
-
Slide Structure
Two independent tables, each with a dark header row, 11 data rows, and 1 total row. Each row contains four columns for numerical input, enabling simultaneous comparison across multiple periods, departments, or product categories.
Related Products
-

Sales Revenue Analysis Table Chart – Efficiency and Reliability
#Operational Plan #Financial Plans and Performance #Diagram
-

Construction Permit and Construction Status Table – Operational Plan and Financial Performance
#Operational Plan #Financial Plans and Performance #Diagram
-

Promotional Product Sales Revenue Structure Table
#Operational Plan #Financial Plans and Performance #Diagram
-

Marketing Budget Allocation Chart – Visualizing Operations and Performance
#Operational Plan #Financial Plans and Performance #Diagram
