Sales & Investment Plan Slide Template
RM0400001_28
- Last Update 02/14/2025
- File Size 0.4MB
- # of Slides 2
- File Format PPTX
- Slide Ratio 16:9
- Color
Keywords
About the Product
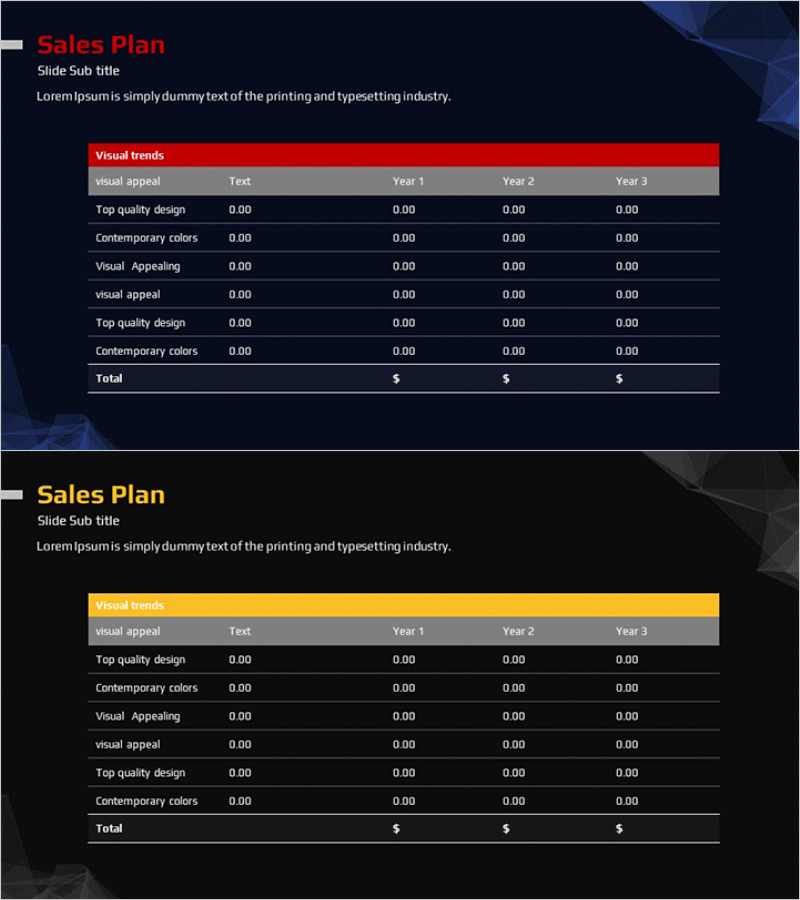
A professional PowerPoint slide for presenting sales and investment plans with year-over-year data comparison. Features a dark navy background with two color variations: red and yellow header options for visual distinction. The table layout includes four columns (Text, Year 1, Year 2, Year 3) with six data rows plus a total row, allowing you to input financial metrics, investment items, and sales figures. This practical slide template is ready to use in business plans, investor pitch decks, operational reports, and financial presentations. Provided in 16:9 widescreen PPTX format compatible with all PowerPoint versions.
Usage Points
-
Main Usage
Present sales forecasts, investment budgets, and financial projections in a clear, comparative format. Enables executives, investors, and stakeholders to quickly understand financial performance and budget allocation across multiple years.
-
How to Use
Enter sales revenue, investment amounts, costs, profit margins, and other financial metrics directly into the table cells. Compare year-over-year trends at a glance. Insert this slide into the financial section of business plans, quarterly reports, investor presentations, and budget reviews.
-
Recommended For
CFOs, financial analysts, business planners, and investment managers presenting financial forecasts. Ideal for startup pitch decks, corporate business plans, quarterly performance reports, budget approval meetings, and financial strategy presentations.
-
Slide Structure
Consists of a header row (Visual trends) and six data rows, each with four columns: item name (Text) and three years of data (Year 1, Year 2, Year 3). A total row at the bottom displays cumulative figures across all categories.
Related Products
-

Sales Revenue Comparison Analysis Table – Effective Operational Planning
#Operational Plan #Financial Plans and Performance #Diagram
-

Sales Plan Table Chart – Efficient Operational Management
#Operational Plan #Financial Plans and Performance #Diagram
-

Sales Revenue Analysis Table Chart – Efficiency and Reliability
#Operational Plan #Financial Plans and Performance #Diagram
-

Table of Operating Capital Securing Strategies – Financial Planning and Performance
#Operational Plan #Financial Plans and Performance #Diagram
