Table of Operating Capital Securing Strategies – Financial Planning and Performance
RM0400010_28
- Last Update 02/17/2025
- File Size 0.7MB
- # of Slides 2
- File Format PPTX
- Slide Ratio 16:9
- Color
Keywords
- #Content-Based Slides
- #Design-Based Slides
- #Operational Plan
- #Financial Plans and Performance
- #Diagram
- #Capital Investment Plan
- #Capital Requirements
- #Table
- #16:9
- #sales plan PowerPoint slide
- #financial table template
- #revenue data visualization PPT
- #business plan table slide
- #how to create a sales table in PowerPoint
About the Product
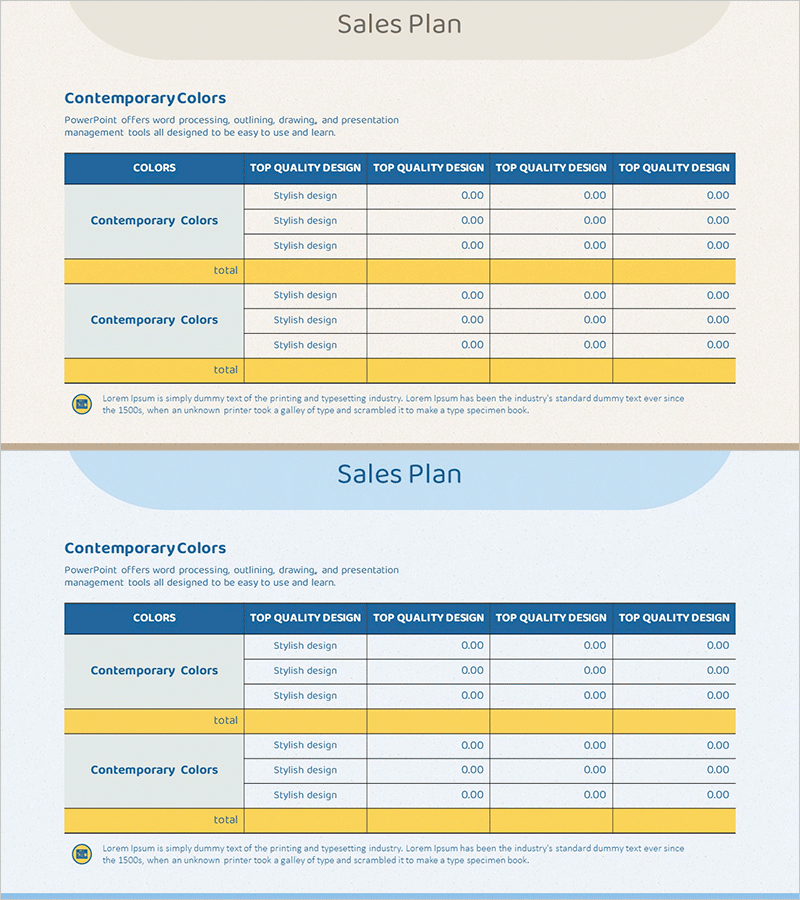
A professional PowerPoint slide designed to present sales strategies and financial performance in a structured table format. Features a dark blue header row and yellow total row that highlight key financial metrics across multiple columns. The layout includes 3-5 data entry columns with placeholder values (0.00 format) for easy customization with actual sales figures, quarterly data, or product-line breakdowns. Ideal for business plans, financial reports, investor presentations, and quarterly performance reviews. Provided in 16:9 widescreen PPTX format with fully editable text and numeric fields, allowing rapid deployment of various financial scenarios and comparative analysis.
Usage Points
-
Main Usage
Visualize sales forecasts and financial performance using a structured two-section table layout that communicates quantitative data clearly to stakeholders and investors. Consolidates multi-dimensional sales data—by product, quarter, region, or budget variance—into a single slide, enhancing presentation efficiency and decision-making clarity.
-
How to Use
Insert into the financial planning section of business proposals, revenue forecast pages of investor decks, or quarterly performance reports. Replace header labels with your actual sales categories and populate data cells with real figures. The color-coded structure (blue header, yellow totals) automatically emphasizes key metrics without additional formatting.
-
Recommended For
Finance managers, CFOs, business development professionals, investor relations teams, and executives presenting sales performance and financial forecasts. Suitable for startup pitch decks, corporate earnings presentations, new business proposals, and financial planning documents requiring credible numerical data representation.
-
Slide Structure
Two-section layout with each section containing a dark blue header row (COLORS, TOP QUALITY DESIGN columns), three data rows with editable fields (0.00 format), and a yellow total row. Upper section represents primary sales category; lower section represents secondary category, enabling side-by-side comparison and multi-dimensional analysis.
Related Products
-

Marketing Budget Allocation Chart – Visualizing Operations and Performance
#Operational Plan #Financial Plans and Performance #Diagram
-

Sales Revenue Analysis Table Chart – Efficiency and Reliability
#Operational Plan #Financial Plans and Performance #Diagram
-

Sales Revenue Comparison Analysis Table – Effective Operational Planning
#Operational Plan #Financial Plans and Performance #Diagram
-

Sales Plan Table Chart – Efficient Operational Management
#Operational Plan #Financial Plans and Performance #Diagram
