Visualize Business Plans with Arrow 4-Step Diagram
RM0400010_32
- Last Update 02/17/2025
- File Size 0.3MB
- # of Slides 2
- File Format PPTX
- Slide Ratio 16:9
- Color
Keywords
- #Content-Based Slides
- #Design-Based Slides
- #Business Management
- #Operational Plan
- #Diagram
- #Implementation Schedule
- #Project Implementation Schedule
- #Cluster
- #Closed Cluster Diagram
- #16:9
- #4-step arrow diagram PowerPoint
- #arrow diagram slide template
- #process flow PowerPoint slide
- #business plan visualization PPT
- #sequential step diagram slide
About the Product
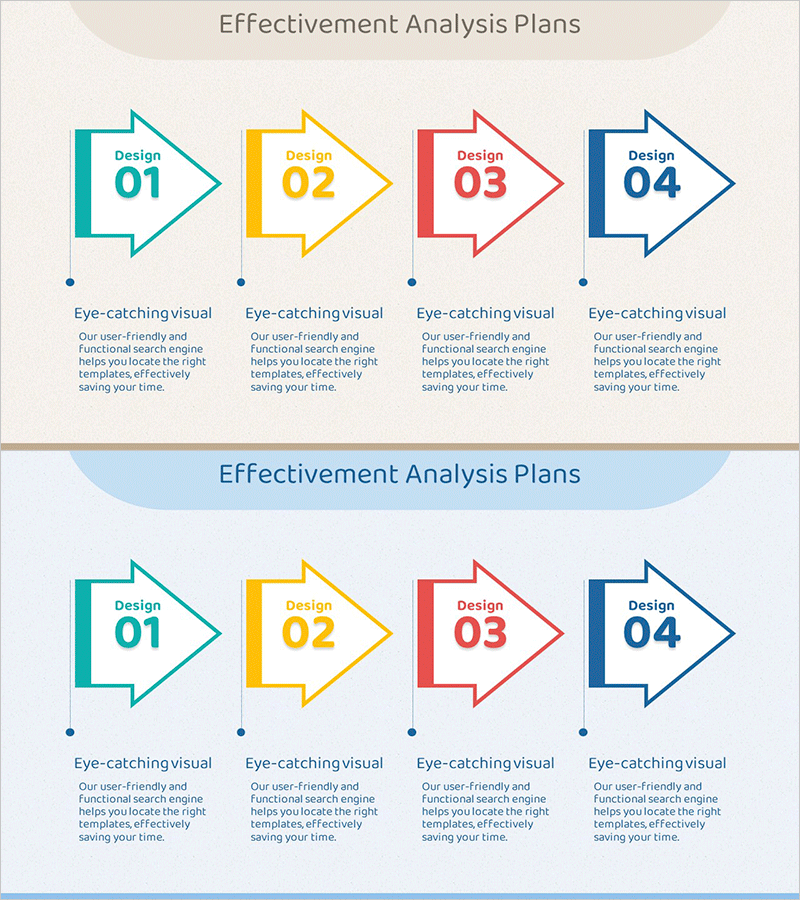
A 4-step arrow diagram PowerPoint slide that visualizes business plans and operational strategies in sequential stages. Four color-coded arrows—teal, yellow, red, and navy blue—flow from left to right, with descriptive text areas positioned below each step. The 2-slide set includes versions with contrasting backgrounds (beige and light blue) for flexible section usage throughout your presentation. This directional flow diagram is ready to use in any business document requiring linear process visualization, project timelines, strategic phases, or operational procedures.
Usage Points
-
Main Usage
Breaks down business plans, operational strategies, project timelines, and marketing phases into four clear sequential steps. The color-coded arrow structure helps audiences quickly grasp the progression and relationships between each phase of your initiative.
-
How to Use
Replace 'Design 01–04' labels with your stage names and add detailed descriptions in the text areas below each arrow. The color scheme is pre-formatted for immediate use; adjust text size and font as needed to match your corporate branding or presentation style.
-
Recommended For
Ideal for business plans, operational roadmaps, marketing strategy presentations, project proposals, and training materials. Recommended for executives, project managers, marketing professionals, and consultants presenting strategic initiatives, implementation timelines, or phased rollout plans.
-
Slide Structure
2-slide set with 4 color-coded arrows (teal, yellow, red, navy) arranged horizontally left to right. Each arrow includes a dot marker and text input area below. First slide features beige background; second slide uses light blue background for section differentiation and visual variety.
Related Products
-

Performance Measurement and Analysis Strategy – Effectiveness Analysis Plans
#Business Management #Operational Plan #Diagram
-

Business Program Characteristics Introduction Diagram – Systematic Approach
#Business Management #Operational Plan #Diagram
-

Innovative Space Industry Schedule – Advanced Operations and Implementation Strategy
#Business Management #Operational Plan #Diagram
-

Medical Product Differentiation Strategy Diagram
#Business Management #Operational Plan #Diagram
