Summer Template Planning Table Chart – Optimizing Business Management and Operations
RJ0600109_25
- Last Update 07/20/2025
- File Size 0.4MB
- # of Slides 2
- File Format PPTX
- Slide Ratio 16:9
- Color
Keywords
- #Content-Based Slides
- #Design-Based Slides
- #Business Management
- #Operational Plan
- #Diagram
- #Implementation Schedule
- #Project Implementation Schedule
- #Table
- #Standard Table
- #16:9
- #table chart PowerPoint
- #horizontal bar graph presentation
- #year-over-year comparison slide
- #business management chart
- #data visualization template
- #bar chart slide design
About the Product
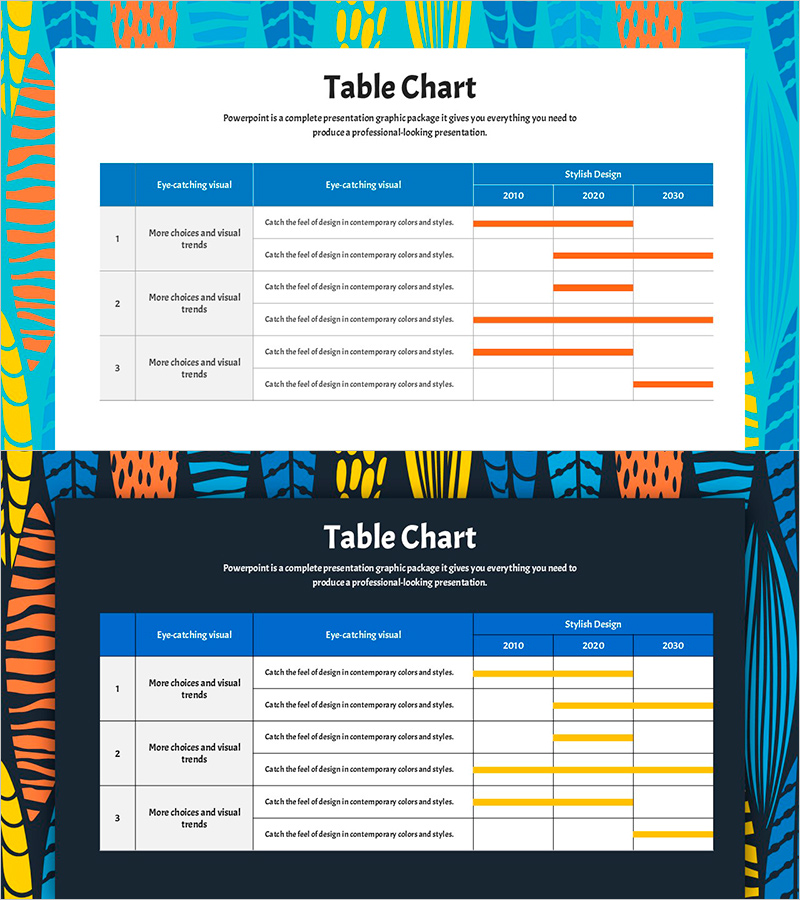
A horizontal bar table chart PowerPoint slide designed for business management and operational optimization. This presentation template features a structured layout with three rows of item descriptions on the left and year-over-year data (2010, 2020, 2030) visualized as horizontal bars on the right. The design combines a dark blue header with orange bars on a light background, ensuring clear data readability and visual hierarchy. Each row accommodates multiple data points, making it ideal for complex information organization and comparative analysis. The slide deck includes two versions—light background and dark background—allowing you to select the version that best matches your presentation theme and venue lighting conditions.
Usage Points
-
Main Usage
This slide enables you to compare numerical data across rows and years using a horizontal bar format. It is ideal for presenting business performance trends, departmental performance comparisons, annual target achievement rates, and other time-based changes. The left text area allows you to add contextual descriptions that enhance data interpretation and audience understanding.
-
How to Use
Edit the three row labels and description text on the left side, then adjust the horizontal bar lengths and colors to match your actual data values. You can customize the time periods (years, quarters, or months) and expand or reduce the number of bars to fit your comparison scope. Choose between the light background and dark background versions depending on your overall presentation design and display environment.
-
Recommended For
This template is well-suited for executives, managers, and planning teams presenting business performance, sales results, project progress, and budget execution status. It is also valuable for marketing teams comparing channel performance, HR teams analyzing workforce metrics, finance teams reviewing quarterly financial indicators, and other departments requiring data-driven decision-making materials.
-
Slide Structure
The slide deck consists of two slides, each featuring a table structure with three rows of item areas (row number, item name, description text) on the left and three year columns (2010, 2020, 2030) on the right. Each row displays three horizontal bars, accommodating nine total data points per slide. The light background version uses a dark blue header with orange bars, while the dark background version features a bright blue header with yellow bars for optimal contrast and visibility.
Related Products
-

Trade Services Schedule – Optimized Diagram for Business Management
#Business Management #Operational Plan #Diagram
-

Mint Green Table Schedule Slide - Enhance Efficiency in Business Management
#Business Management #Operational Plan #Diagram
-

Summer Itinerary – Travel Planning and Style
#Business Management #Operational Plan #Diagram
-

Schedule Slide Template for Efficient Journeys
#Business Management #Operational Plan #Diagram
