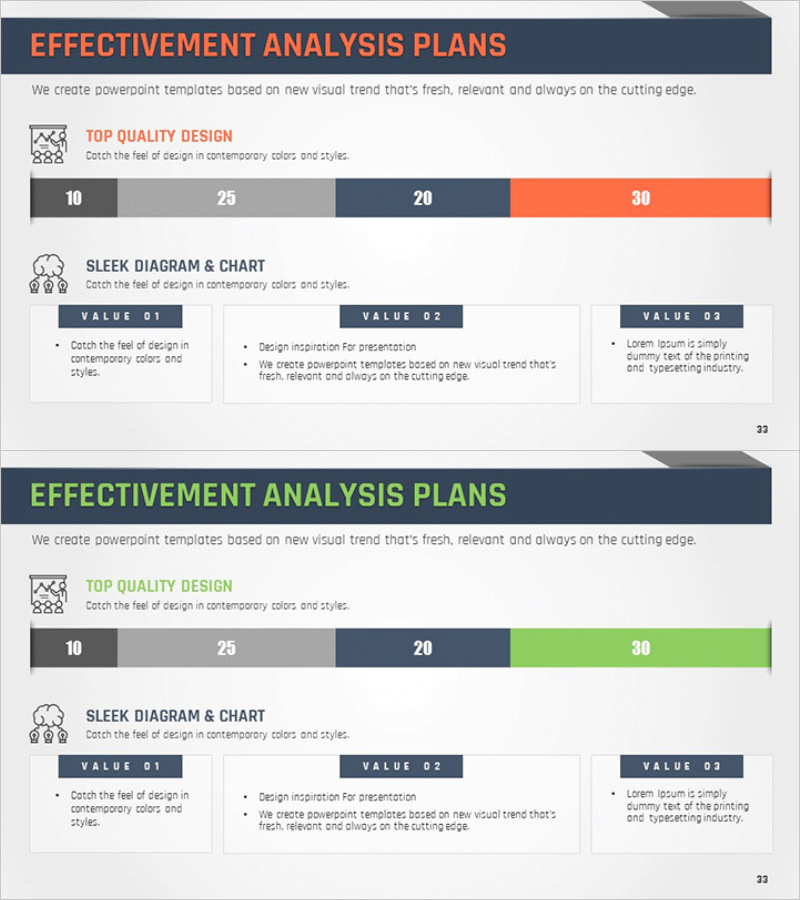
Performance Measurement and Analysis Strategy – Effectiveness Analysis Plans
RM0400008_32
- Last Update 02/17/2025
- File Size 0.3MB
- # of Slides 2
- File Format PPTX
- Slide Ratio 16:9
- Color
Keywords
- #Content-Based Slides
- #Design-Based Slides
- #Business Management
- #Operational Plan
- #Diagram
- #Graph
- #Other
- #Implementation Schedule
- #Project Implementation Schedule
- #Cluster
- #Closed Cluster Diagram
- #16:9
- #closed cluster diagram PowerPoint
- #overlapping diagram slide template
- #performance measurement PowerPoint
- #effectiveness analysis slide
- #how to create cluster diagram in PowerPoint
- #business management presentation template
About the Product
A closed cluster diagram PowerPoint slide designed for performance measurement and effectiveness analysis presentations. The design features three overlapping areas centered around a core concept, visualizing the relationships between interconnected elements. The color scheme combines dark blue, gray, and orange tones to emphasize professionalism, with text and icon placement in each area ensuring clear information delivery. This PowerPoint template is ready to use for business management, strategy development, and performance analysis presentations, with a 2-slide structure accommodating various analytical content.
Usage Points
-
Main Usage
Optimized for expressing performance measurement and effectiveness analysis results through three interconnected areas. The design visualizes the impact and intersection of surrounding elements around a central concept, making complex analytical findings easy to understand and communicate at a glance.
-
How to Use
Use in business management, strategy development, and performance analysis presentations by entering measurement items, analysis results, and improvement plans in each area. Leverage text boxes and icons to emphasize area characteristics, and use color differentiation to clarify information hierarchy. The 2-slide structure allows continuous representation of multiple analytical topics.
-
Recommended For
Ideal for business managers, strategy planning teams, performance management departments, consultants, and educators presenting efficiency analysis, business performance evaluation, and strategy development. Particularly useful when expressing both quantitative analysis results and qualitative assessments simultaneously.
-
Slide Structure
2-slide composition. Each slide features a closed cluster structure with three overlapping areas centered around a core concept. Each area includes text input space and icon placement zones, with dark blue, gray, and orange colors distinguishing the areas. A title section and descriptive text space are included at the top of each slide.
Related Products
-

System Learning Data Graph – Clear Market Analysis
#Market and Competitor Analysis #Diagram #Graph
-

Human Resources Data Analysis - Effective Customer Management Strategies
#Company Introduction #Market and Competitor Analysis #Diagram
-

Visualize Business Plans with Arrow 4-Step Diagram
#Business Management #Operational Plan #Diagram
-

Business Customer Analytics Slide – Strategic Insights
#Business Vision and Strategy #Market and Competitor Analysis #Diagram
