Industry Trend Analysis Donut Chart – Visual Trends Presentation
RM0400009_7
- Last Update 02/17/2025
- File Size 1.4MB
- # of Slides 2
- File Format PPTX
- Slide Ratio 16:9
- Color
Keywords
- #Content-Based Slides
- #Design-Based Slides
- #Market and Competitor Analysis
- #Diagram
- #Graph
- #Market Analysis
- #Market Overview
- #Table
- #Circles
- #Standard Table
- #Doughnut Chart
- #16:9
- #donut chart PowerPoint slide
- #pie chart presentation template
- #market segmentation analysis
- #industry trend visualization
- #data chart download
About the Product
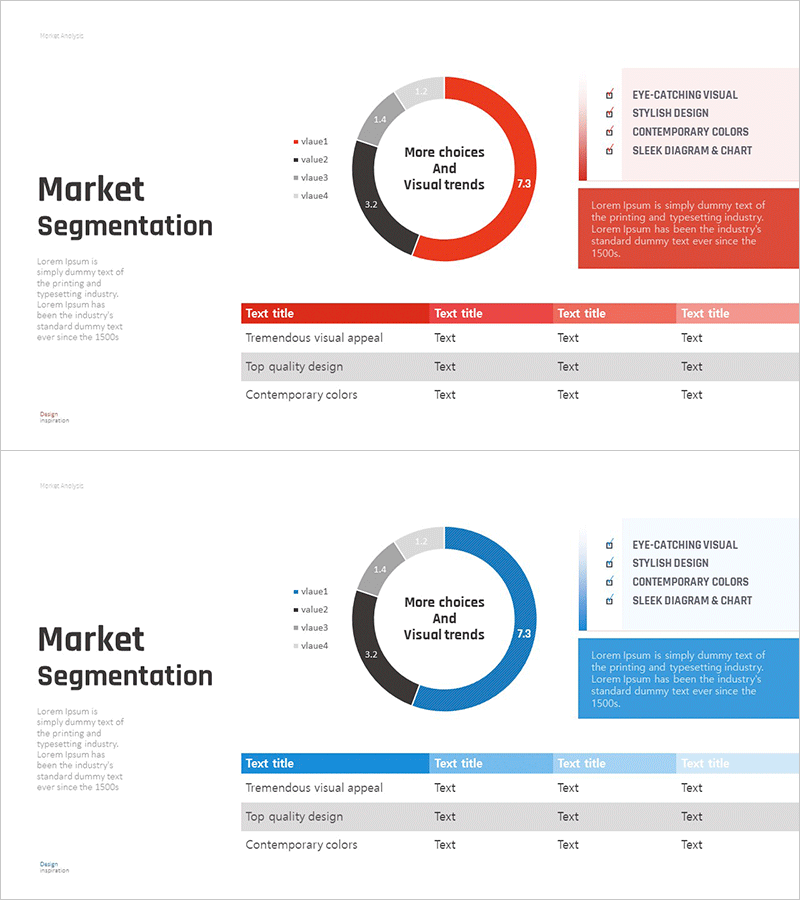
A donut chart PowerPoint slide designed for market segmentation and industry trend analysis. The slide features a four-segment pie chart with a central message area, using red, black, and gray tones to clearly distinguish data categories. An explanatory box on the right side and a comparison table below provide both quantitative metrics and qualitative insights. The two-slide set enables presenters to visualize market share distribution and segment characteristics simultaneously, making it ideal for business reports, strategic presentations, and investor pitches.
Usage Points
-
Main Usage
Visualize market share distribution, industry trend analysis, customer demographic composition, and product category penetration rates across four segments. The central text area emphasizes key insights while the legend clearly identifies each segment, enabling stakeholders to grasp market dynamics at a glance.
-
How to Use
Input actual data values into the four donut segments; the chart automatically recalculates proportions. Add segment descriptions in the right-side text box and populate the bottom comparison table with detailed statistics and analysis. Colors are fully editable to match corporate branding guidelines.
-
Recommended For
Marketing managers, business strategists, and analysts presenting market research to executives, clients, and investors. Ideal for business plans, marketing strategy documents, quarterly reports, and investor pitch decks where market overview sections require data-driven visual support.
-
Slide Structure
Slide 1: Title + 4-segment donut pie chart with central text area + right-side explanation box + legend. Slide 2: Identical donut chart + bottom comparison table (4 rows × 4 columns with header). 16:9 widescreen format, fully editable PPTX with all elements customizable.
Related Products
-

Performance Analysis with Donut Chart and Table
#Market and Competitor Analysis #Diagram #Graph
-

Market Analysis Donut Chart & Table Slide
#Market and Competitor Analysis #Diagram #Graph
-

Detailed Analysis in Book Illustration PowerPoint Template
#Market and Competitor Analysis #Diagram #Graph
-

Status Analysis Donut Chart – Shareholder Status Analysis
#Company Introduction #Market and Competitor Analysis #Diagram
