Market Trend Change Analysis Graph – Key Insights Visualization
RM0400009_6
- Last Update 02/17/2025
- File Size 0.7MB
- # of Slides 2
- File Format PPTX
- Slide Ratio 16:9
- Color
Keywords
- #Content-Based Slides
- #Design-Based Slides
- #Product/Service Introduction
- #Market and Competitor Analysis
- #Graph
- #Development Status
- #Industry Trends
- #Circles
- #Doughnut Chart
- #16:9
- #donut chart PowerPoint slide
- #pie chart template
- #ratio comparison slide
- #market trend analysis PPT
- #data visualization PowerPoint
- #how to create donut chart in PowerPoint
About the Product
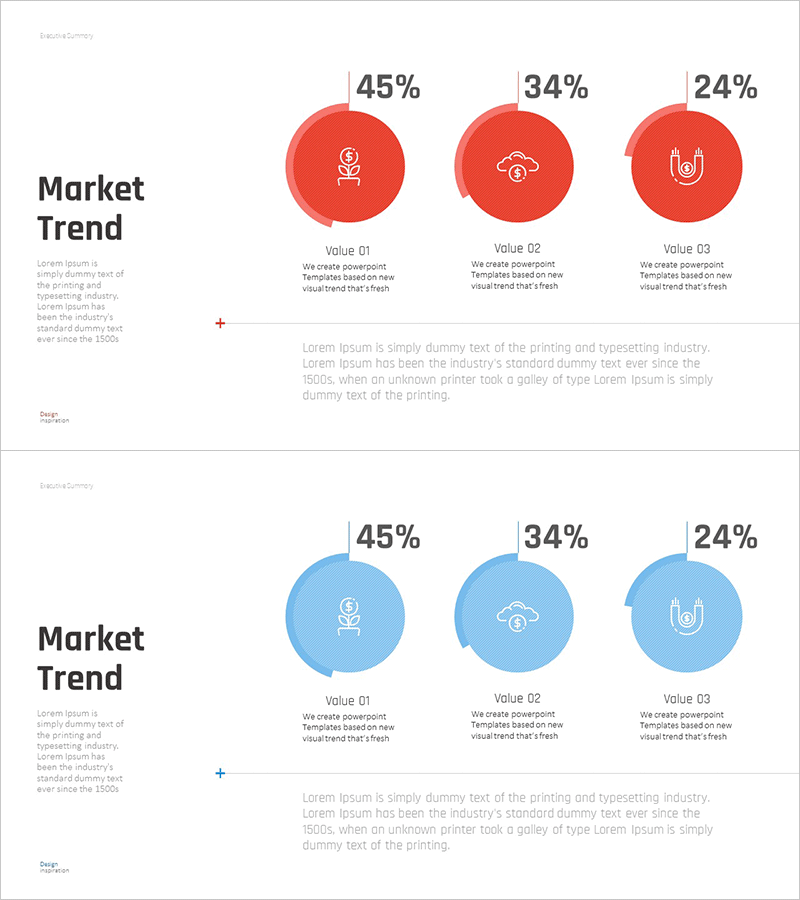
A donut chart PowerPoint slide designed for market trend analysis and data visualization. This presentation template displays three data points (45%, 34%, 24%) with corresponding icons and descriptive labels beneath each segment. Two color versions—red and blue—allow you to match your presentation theme and audience context. The donut format emphasizes proportional relationships while leaving central space for additional messaging. Ideal for marketing reports, competitive analysis, product launches, and executive briefings where data-driven insights are essential.
Usage Points
-
Main Usage
Visualize proportional relationships among three key metrics—market share, product adoption rates, customer preferences, or performance indicators. The donut format clearly shows part-to-whole relationships while the hollow center provides space for highlighting a central metric or key message.
-
How to Use
Insert into marketing strategy presentations, quarterly business reviews, market analysis reports, product introduction decks, and executive dashboards. Edit the percentages, labels, and icons to reflect your actual data. Switch between red and blue color schemes to align with your corporate branding or presentation tone.
-
Recommended For
Marketing managers, business development professionals, executives, management consultants, data analysts, and product managers. Particularly effective for quarterly performance reviews, market positioning discussions, customer segmentation strategies, and competitive landscape presentations.
-
Slide Structure
Two-slide set featuring identical donut chart layouts in contrasting color palettes. Each slide contains three circular segments with percentage values, icons, and labels. A descriptive text area spans the bottom of each slide for detailed explanations. Formatted in 16:9 widescreen ratio for modern presentation environments and seamless integration with contemporary business tools.
Related Products
-

Cat Donut Chart – Data Analysis and Creativity
#Product/Service Introduction #Business Introduction #Diagram
-

Data Status Analysis Pie Chart – Intuitive Visualization
#Product/Service Introduction #Graph #Other
-

Development Status Analysis Donut Graph – Visualizing Competitive Advantage
#Product/Service Introduction #Market and Competitor Analysis #Graph
-

Detailed Analysis Circle Graph Presentation Template
#Product/Service Introduction #Market and Competitor Analysis #Graph
